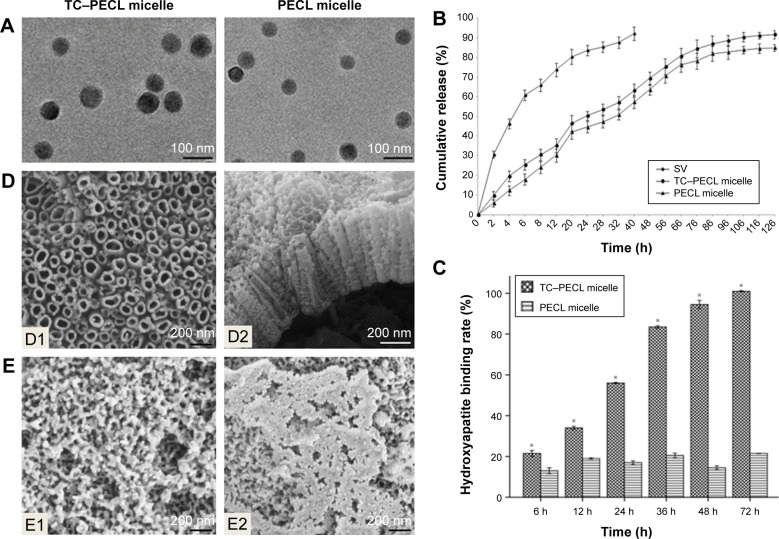
Figure 3.
Images and graphs for properties of micelles and TNT.
Notes: (A) TEM images of SV-loaded micelles including TC–PECL and PECL micelles (15,000× magnification). (B) In vitro drug release profile of SV-loaded TC–PECL micelles, SV-loaded PECL micelles, and free SV. (C) Hydroxyapatite-binding rate of TC–PECL and PECL micelles. Data are expressed as mean ± standard error of the mean (n=3), ※P<0.05 indicates significance vs the PECL micelle. (D) Field-emission SEM images of the morphology of TNTs: D1, top view of the nanotubular surface showing a tube diameter of ~100–120 nm (50,000× magnification); D2, cross-sectional view of a mechanically fractured sample showing that the length of the tubes is ~400 nm (30,000× magnification). (E) Field-emission SEM images of the morphology of TNTs loaded with micelles (30,000× magnification): E1, image of the TNT loaded with SV-loaded TC–PECL micelles; E2, SEM image of the TNT loaded with SV-loaded PECL micelles.
Abbreviations: PCL, poly(ε-caprolactone); PECL, PEG–PCL; PEG, poly(ethylene glycol); SEM, scanning electron microscopy; SV, simvastatin; TC, tetracycline; TEM, transmission electron microscopy; TNT, titania nanotube.

