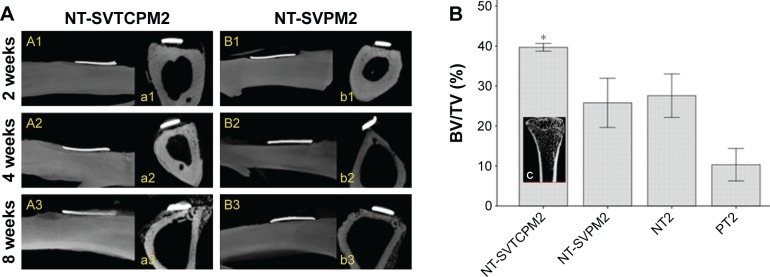
Figure 9.
The results of m-CT analysis in ovariectomized rats (2).
Notes: (A) m-CT images for implant–bone integration around the implant site for implants with NT-SVTCPM and NT-SVPM surfaces in ovariectomized rats at 2, 4, and 8 weeks after implantation (A1–B1, A2–B2, and A3–B3 for a sagittal view of complete 3D images; a1–b1, a2–b2, and a3–b3 for cross-sectional 2D screenshots). (B) BV/TV for the tibia compartment in the knee joint near the implant site in ovariectomized rats at 8 weeks after implantation. Data are expressed as mean ± standard error of the mean (n=3), *P<0.05 indicates significance vs PT; c), coronal 3D screenshot for the tibia compartment in the knee joint near the implant site in ovariectomized rats.
Abbreviations: 2D, two dimensional; 3D, three dimensional; BV, bone volume; m-CT, microcomputed tomography; NT, uncoated TNTs; NT-SVPM, TNTs loaded with SV-loaded PECL micelles; NT-SVTCPM, TNTs loaded with SV-loaded TC-grafted PECL micelles; PCL, poly(ε-caprolactone); PECL, PEG–PCL; PEG, poly(ethylene glycol); PT, polished Ti; SV, simvastatin; TC, tetracycline; Ti, titanium; TV, total volume.

