Figure 2.
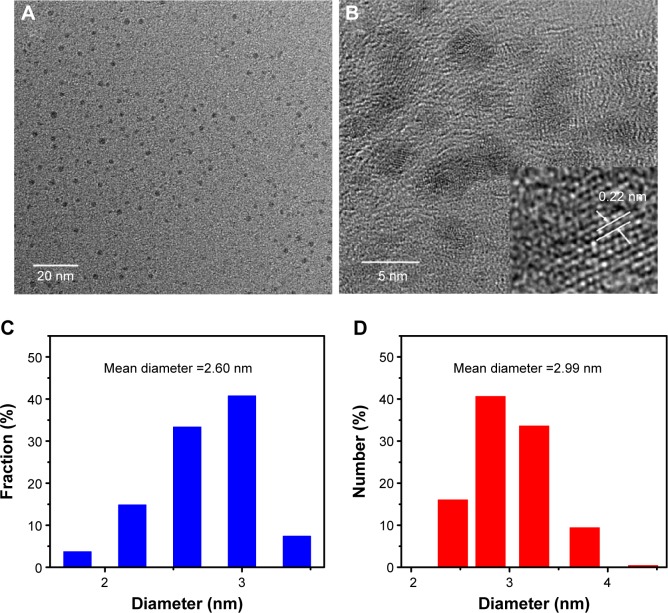
The image and size distribution of N-CDs.
Notes: The TEM image (A) and size distribution (C) of N-CDs. An HRTEM image of a single N-CD particle. The inset shows one in-plane lattice spacing of the N-CDs, as indicated by arrows (B). The size distribution of N-CDs measured by DLS analysis (D).
Abbreviations: DLS, dynamic light scattering; HRTEM, high-resolution transmission electron microscopy; N-CDs, nitrogen-doped carbon dots; TEM, transmission electron microscopy.

