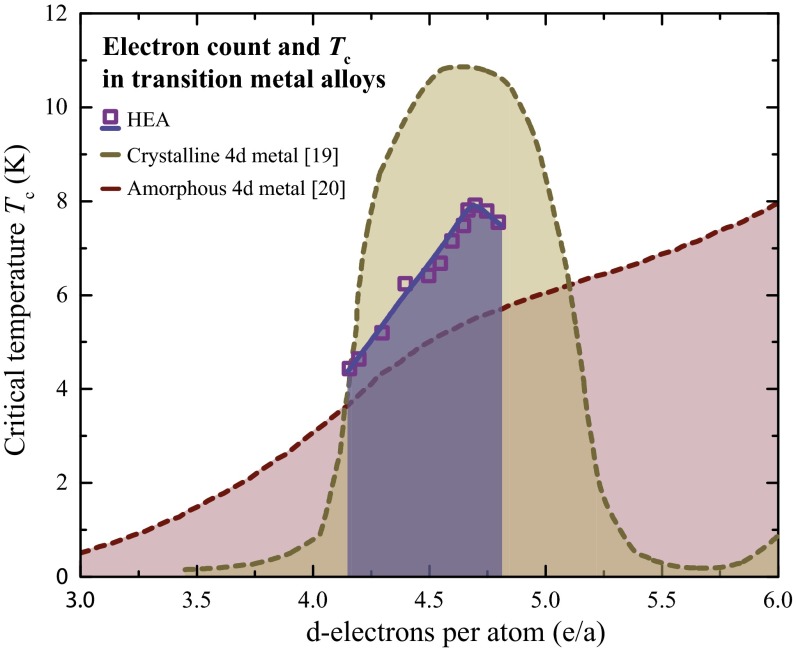
Fig. 4.
Electron-count–dependent superconducting transition temperatures in the high-entropy alloy compared with those in analogous simple solid solution and amorphous phases. Shown is a phase diagram of (purple squares are the and the blue line is a trend line) in comparison with transition metals and their alloys in the crystalline form (19) (yellow dashed line) and as amorphous vapor-deposited films (20) (red dashed line). The superconducting transition temperatures are plotted as function of the electron/atom ratio.

