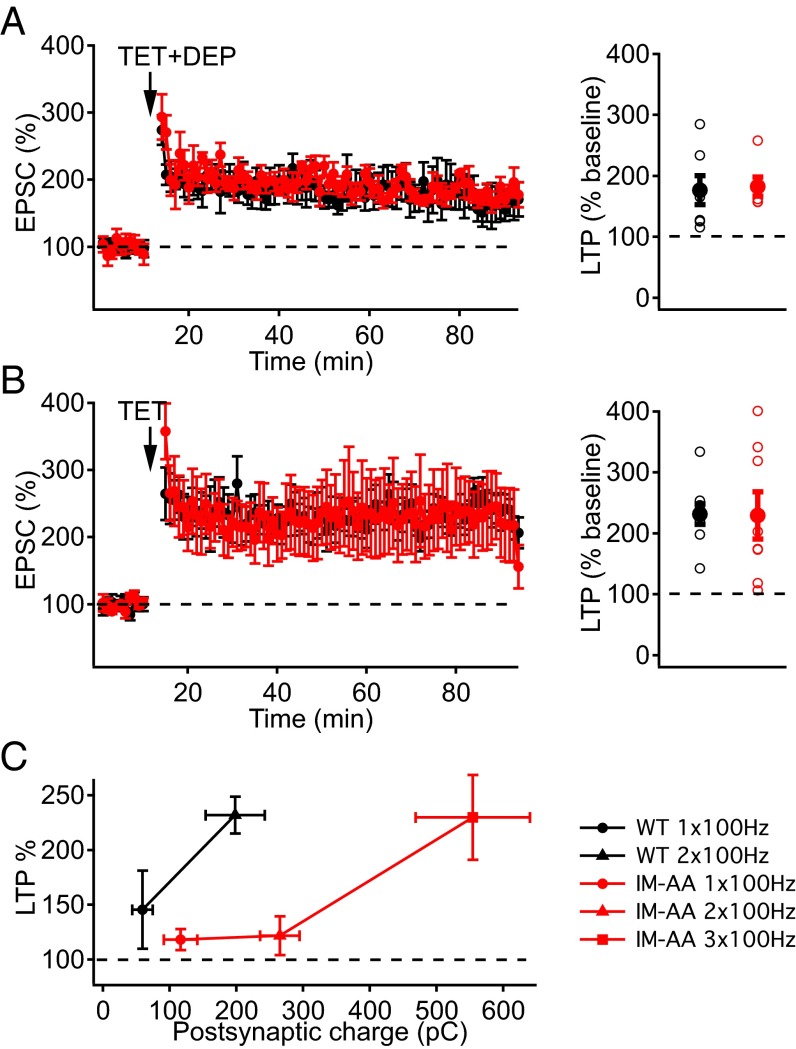
Fig. 2.
Induction of LTP in IM-AA SC-CA1 synapses by stronger stimulation and postsynaptic depolarization. (A) LTP induced by two 100-Hz trains at 0 mV in the presence of 1 μM ω-Ctx, 50 μM picrotoxin, and 10 μM CGP55845 hydrochloride from WT (black, n = 7) and IM-AA (red, n = 6) (Left). LTP values from individual cells (open symbols) and average LTP values (solid symbols) from WT (black) and IM-AA (red) are shown at Right. (B) LTP induced at −60 mV by two 100-Hz trains from WT (black, n = 8) and by three 100-Hz trains from IM-AA (red, n = 8) in the presence of 1 μM ω-Ctx, 50 μM picrotoxin, and 10 μM CGP55845 hydrochloride (Left). (Right) Summarized LTP values as in A. (C) Relationship between postsynaptic charge during 1x, 2x, 3x 100-Hz trains used to induce LTP and the normalized percentage of LTP from WT (black, n = 4–7) and IM-AA (red, n = 4–6).

