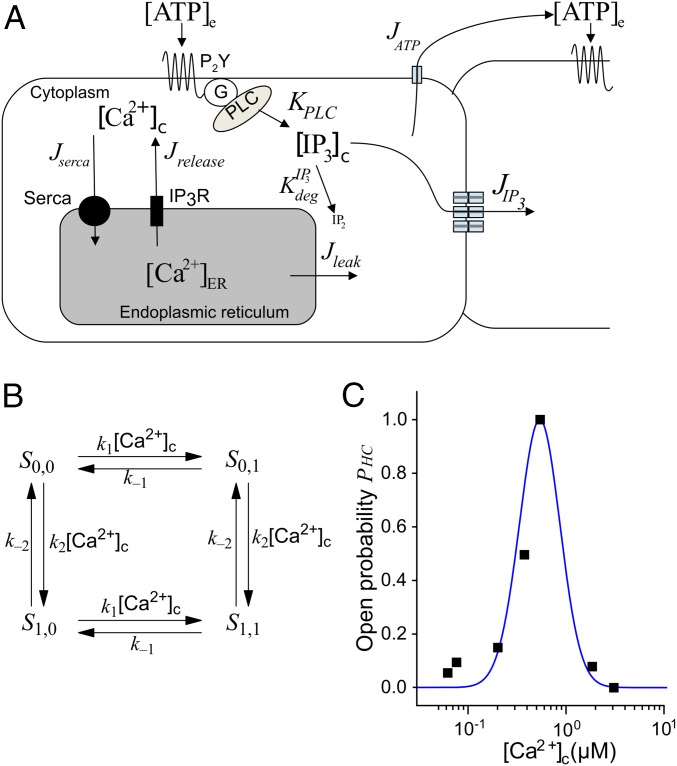
Fig. 1.
Components of the computational model of Ca2+ dynamics in cochlear nonsensory cells. (A) Schematic representation of the model. Letters J and K indicate fluxes through channels/pumps and rate of production/degradation, respectively (all in μM·s−1). (B) Four-state model of a connexin hemichannel. (C) Hemichannel open probability as a function of [Ca2+]c. Black squares, data from ref. 22; blue solid line, fit generated by the model in B.

