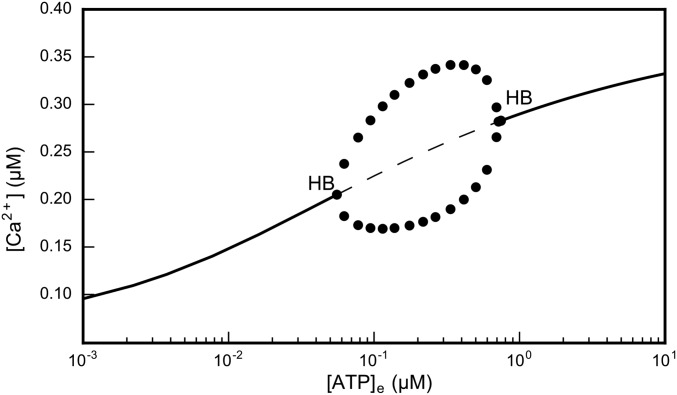
Fig. 3.
Bifurcation diagram generated by the computational model. The solid and the dashed lines indicate, respectively, stable and unstable solutions of the system of differential equations described in Supporting Information. Circles indicate the amplitude of steady-state oscillations. The appearance and disappearance of self-sustained [Ca2+]c oscillations are determined by two supercritical Hopf bifurcations (HB) at [ATP]e ≈ 0.055 μM and [ATP]e ≈ 0.745 μM.

