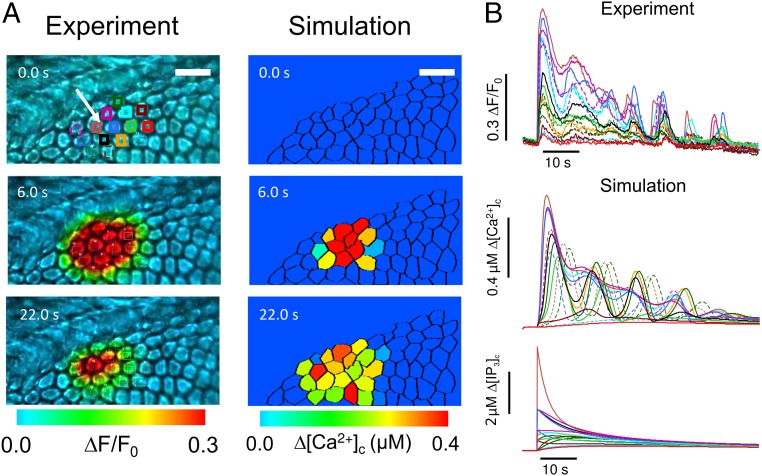
Fig. 5.
Focal photoactivation of caged IP3: comparison between experiments and simulations. (A) Cochlear cultures were loaded with the photoactivatable precursor of IP3. [Ca2+]c oscillations and the propagation of Ca2+ signals between adjacent cells were elicited by illuminating a single cell, indicated by the white arrow, with a brief pulse of UV light (365 nm). Photolytic release of IP3 was reproduced in silico by a step increase of intracellular IP3 concentration. (Scale bar: 20 µm.) (B) Time course of [Ca2+]c signals in experiments (Top) and simulations (Middle) from the regions of interest shown in A. The bottom set of traces is the corresponding model [IP3]c signals.

