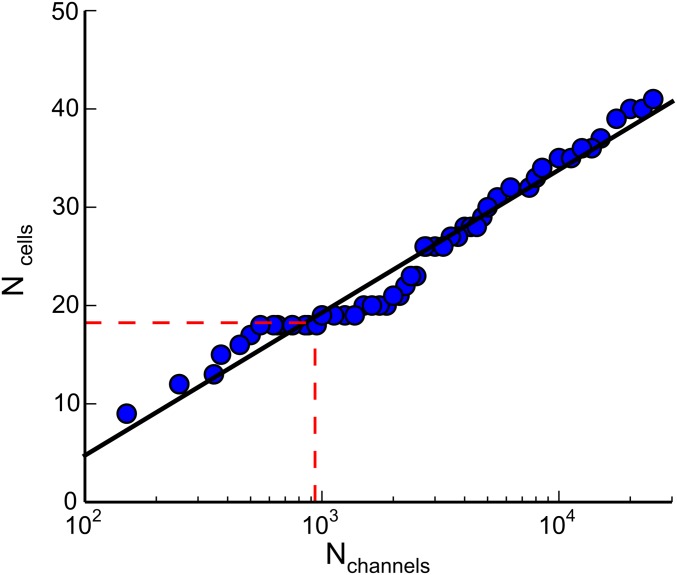
Fig. S5.
Estimate of the number of gap junction channels coupling each pair of nonsensory cells. The number of cells involved in the propagation of Ca2+ signals after photolytic release of IP3 (see text for details) is plotted as a function of the number Nch of gap junction channels coupling each pair of nonsensory cells. The straight line through the model data points is a fit with function f (x) = A log(x/B), where A = 6.31 and B = 47.08. The red dashed line indicates the average number of cells invaded by the Ca2+ signal computed from experiments.

