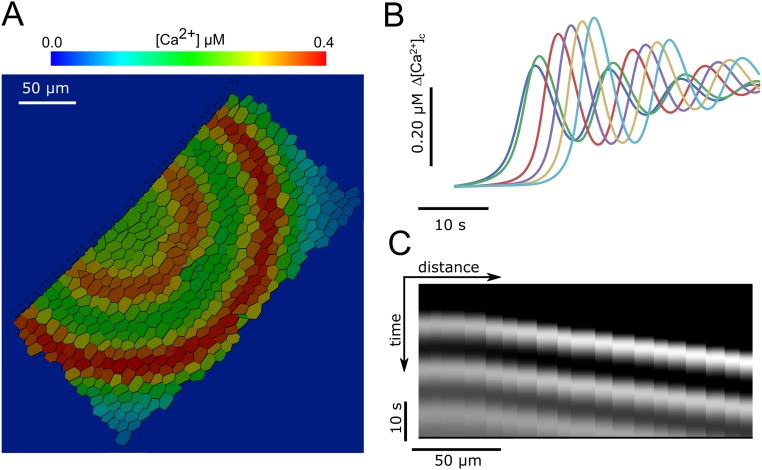
Fig. S6.
Oscillatory Ca2+ waves generated by the model. (A and B) For some parameter combinations (here = 250.0 μM·s−1, = 0.001 s−1) oscillatory Ca2+ waves propagate in a radial fashion from the stimulation point. (C) Kymograph from the example shown in A and B, representing the variation in time of [Ca2+]c along a line from the point of ATP application. Periodic diagonal bands indicate the propagation of Ca2+ oscillations.

