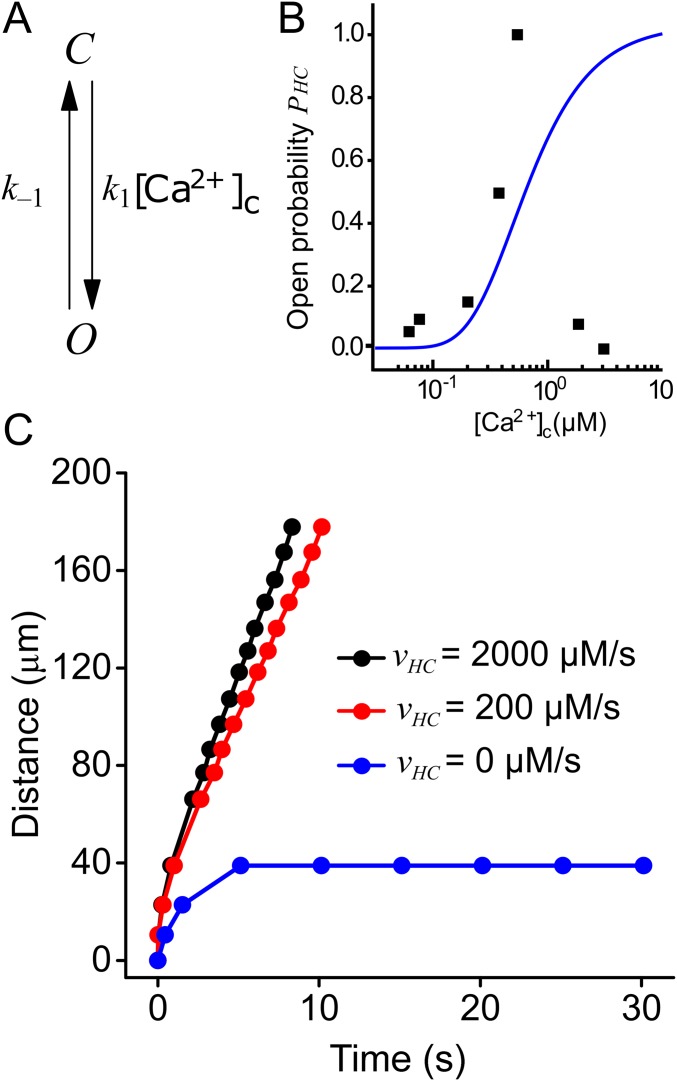
Fig. S7.
Ca2+ wave propagation with a two-state hemichannel model. (A) Two-state model of a connexin hemichannel. The model comprises a closed (C) and an open (O) state. (B) Hemichannel open probability as a function of [Ca2+]c (blue line) for the two-state hemichannel model. Black squares represent the data used to fit the four-state model in Fig. 1 of the main text. (C) The maximal radius of Ca2+ waves triggered by focal ATP application plotted against time for different values of (0.0, 200.0, and 2,000.0 μM·s−1) at constant = 0.001 s−1. For the two-state hemichannel model, k1 = 30 µM−1·s−1, k−1 = 1 s−1. For all other model parameters, see Table S1.

