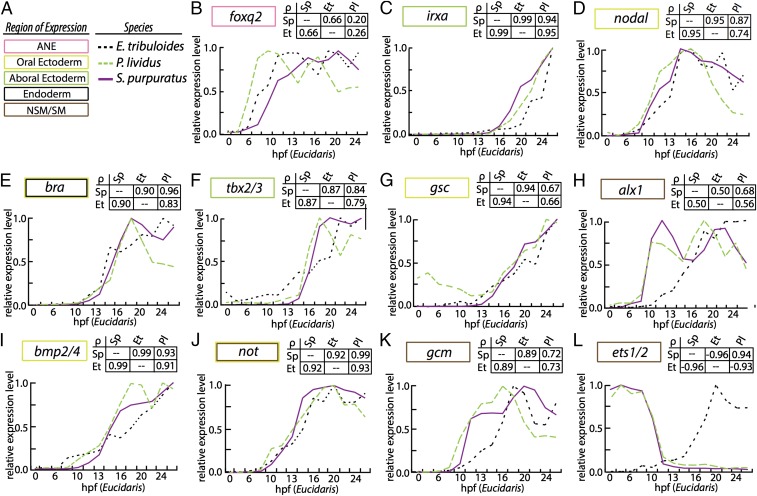
Fig. 4.
Comparative gene expression analyses of echinoid regulatory orthologs. (A) Domain of expression is indicated by a colored box. Species is indicated by purple line (Sp); green dashed line (Pl); or black dashed line (Et). (B) foxq2. (C) irxa. (D) nodal. (E) bra. (F) tbx2/3. (G) gsc. (H) alx1. (I) bmp2/4. (J) not. (K) gcm. (L) ets1/2. Transcripts per embryo were normalized to its maximal expression over the first 30 h of development and are plotted against Et development on the x-ordinate. Comparative developmental staging for each species is listed in SI Appendix, Table S1. Each analysis is accompanied by a matrix of Spearman correlation coefficients (indicated as ρ).

