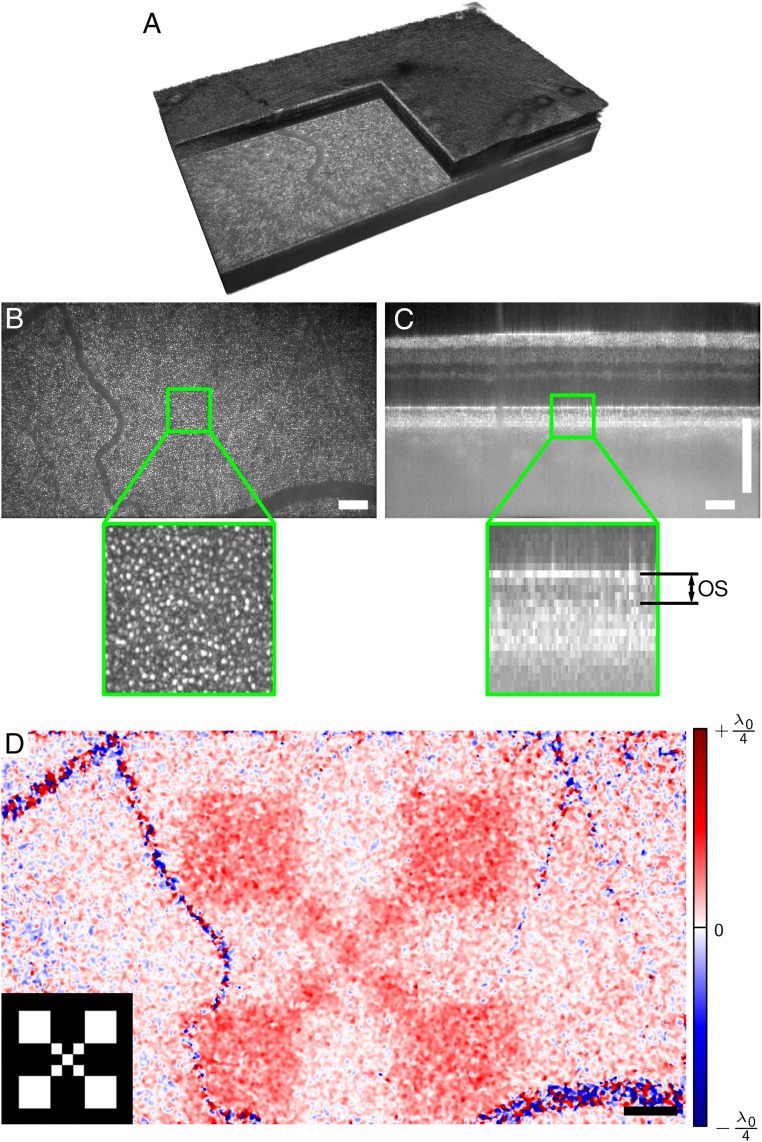
Fig. 2.
Retinal imaging and response to an optical stimulus. (A) Volume of retina acquired by full-field swept-source OCT. (B) En face plane showing the backscattered intensity from the outer segment. Cone photoreceptors are clearly visible. (C) Cross-sectional view (B-scan) from the center of the recorded volume. Changes of the optical path length within the outer segment (OS) were evaluated in this study. (D) Spatially resolved change of the optical path length , 247 ms after switching off the stimulus pattern, which is shown in Lower Left Inset. Response is high in the stimulated region and random in blood vessels. Noise was reduced by a lateral Gaussian filter. The center wavelength of the OCT setup was 841 nm. (Scale bars, 200 μm.)

