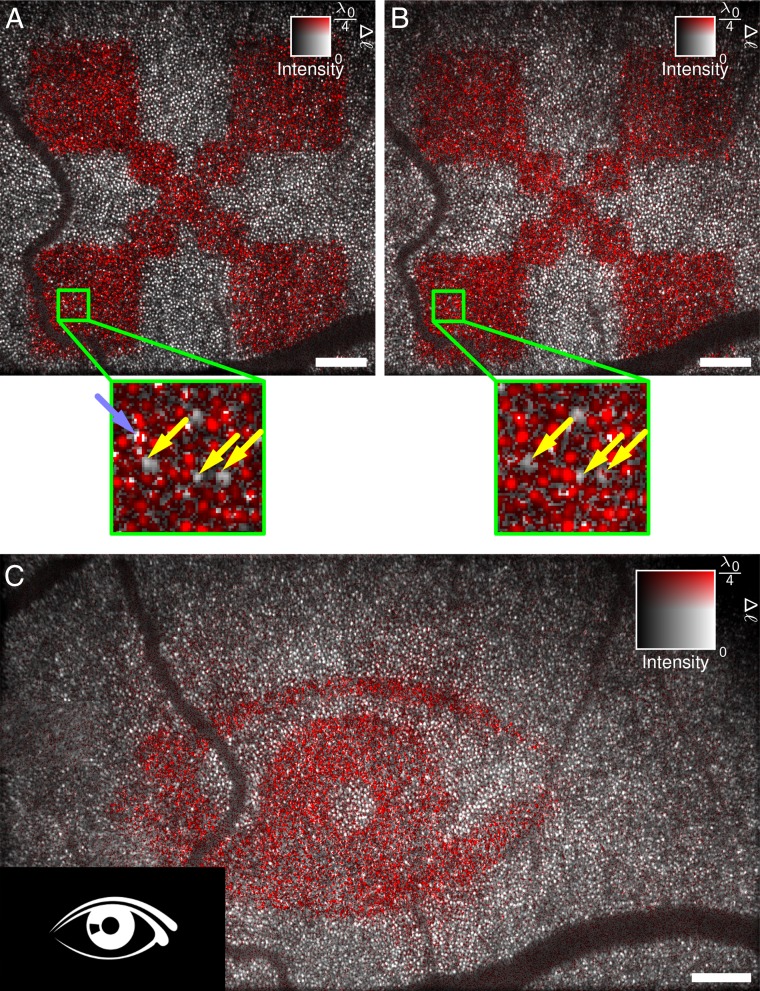
Fig. 4.
After numerical aberration correction, optical path length changes can be assigned to single cones. (A and B) Independent responses to 3-s light stimulus were measured about 10 min apart. Due to the high lateral resolution, individual photoreceptors can be identified. Here, the same cones did not respond to the stimulus (yellow arrows). Some locations show abrupt phase changes within a single cone (light blue arrow). (C) More complicated stimulation patterns can be identified and show which photoreceptors contribute to an image seen by the test person. The pattern of activated photoreceptors is mirrored compared with the stimulus pattern. The center wavelength of the OCT setup was 841 nm. Intensity data in these images were averaged over IS/OS junction and OS tips. (Scale bars, 200 μm.)

