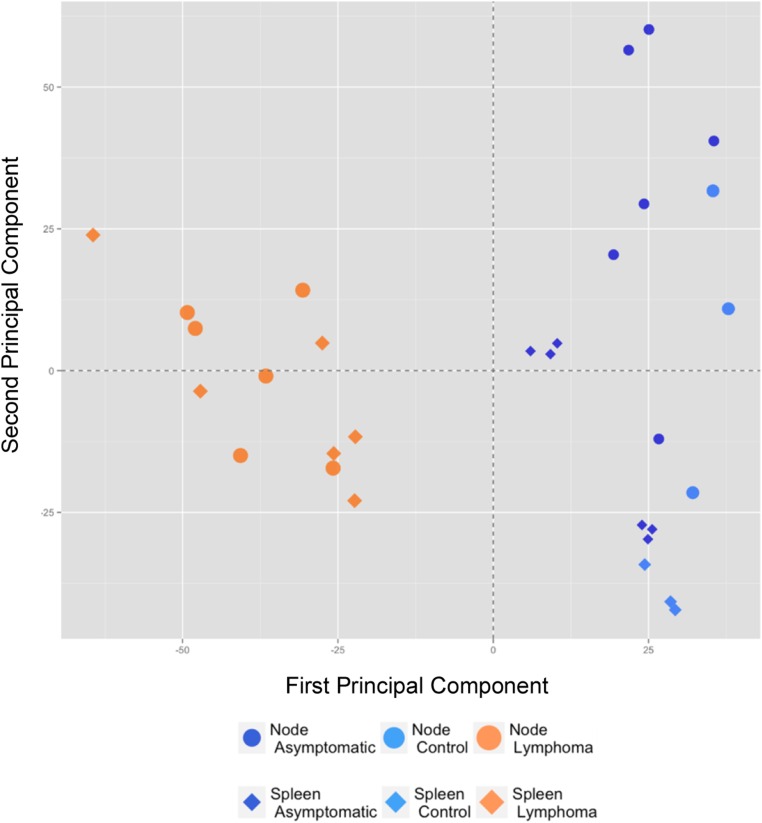
Fig. S4.
Microarray analysis of Tg26 lymphomas. Principal component analysis shows that the lymphoma samples from spleen and lymph node of Tg26 mice (n = 6; orange symbols) are similar to one another, whereas tissue samples from asymptomatic Tg26 (n = 6; dark-blue symbols) and FVB/N controls (n = 3; light-blue symbols) cluster together to the right. The relationship between the analyzed animal groups used the top 10% most variant genes.

