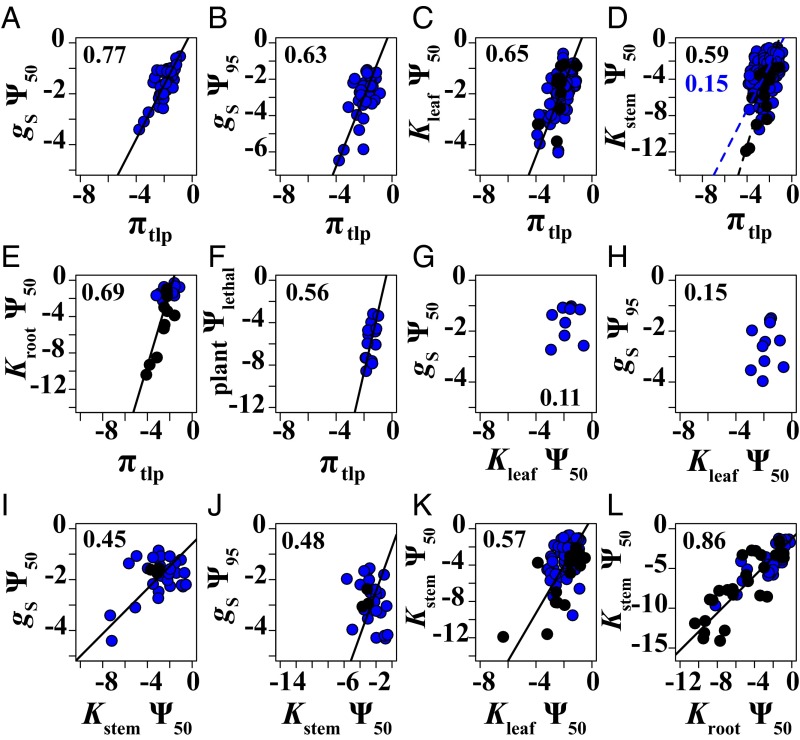
Fig. 1.
Correlations among drought tolerance traits across species. Symbols follow Table 1. Blue points represent angiosperms, and black points represent gymnosperms. Solid black lines are standard major axis relationships that are significant across all species. Dashed lines are correlations that are significantly different between the gymnosperms (black lines) and angiosperms (blue lines). All significant correlations remained significant after correcting for multiple tests (46). The r values are shown on each graph, and P values and sample sizes are in SI Appendix, Table S2. All of the traits were significantly correlated (A–F and I–L), except for Kleaf Ψ50 and gS Ψ50 (G) and gS Ψ95 (H). For graphical clarity, correlations with Kstem Ψ12 and Ψ88 are not shown. All of the stem hydraulic traits showed the same correlations, except that Kstem Ψ12 was not significantly correlated with gS Ψ50 and Kleaf Ψ50 was not significantly correlated with Kstem Ψ88 (SI Appendix, Table S2). Kstem Ψ12 was significantly correlated with Kleaf Ψ50 in the gymnosperms but not the angiosperms, whereas the two functional types showed significantly different slopes for the correlations of Kstem Ψ50 with πtlp (D) and with Kstem Ψ12 (SI Appendix, Table S4). We did not compile variation in plant Ψlethal from the literature, because most published studies use different definitions for plant death, but instead show this correlation from the largest study of these traits (11) for comparison with the other correlations with πtlp (F).

