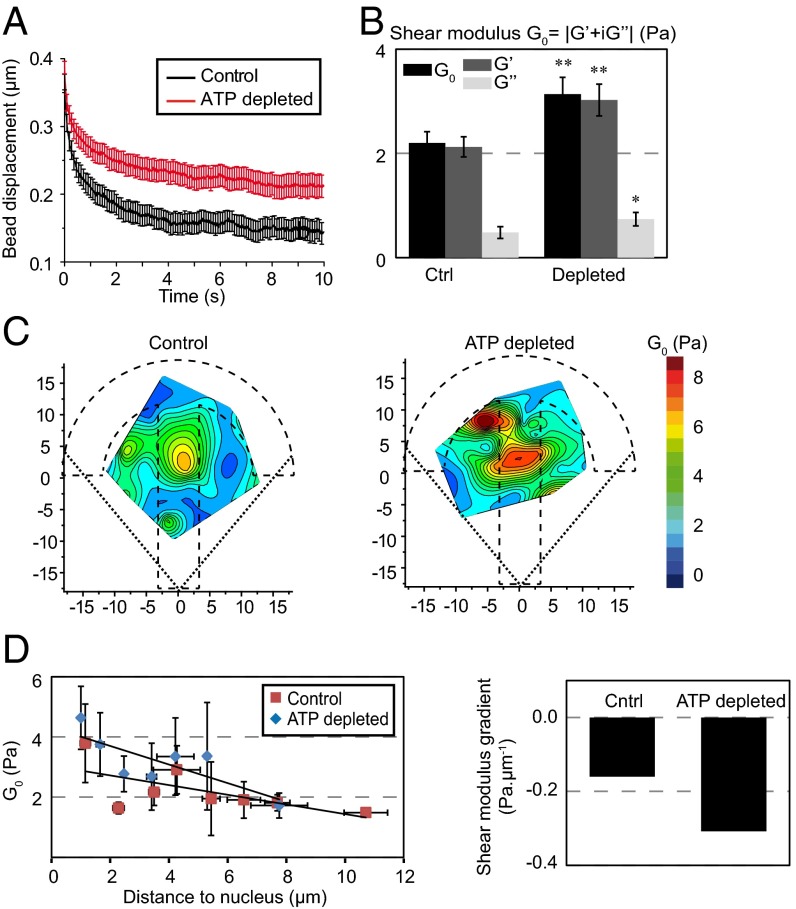
Fig. 5.
Energy depletion stiffens the cell cytoplasm. (A) Relaxation curves for control cells (black) and for cells depleted in ATP (red). (B) Average values of the shear modulus G0, the storage modulus G′, and the loss modulus G″ in control cells and in cells depleted with ATP. (C) Maps showing the distribution of the shear modulus G0 in control cells and in cells depleted in ATP. (D) Plots of the shear modulus as a function of the distance to the nucleus in control cells and in cells depleted in ATP (Left) and corresponding shear modulus gradients (Right). Data were obtained from n = 33 and 37 beads in control and ATP depletion conditions, respectively. Error bars represent SEs. P values are determined from Student’s t test for unpaired samples with respect to control cells (**P < 0.001; *P < 0.01; and n.s., nonsignificant).

