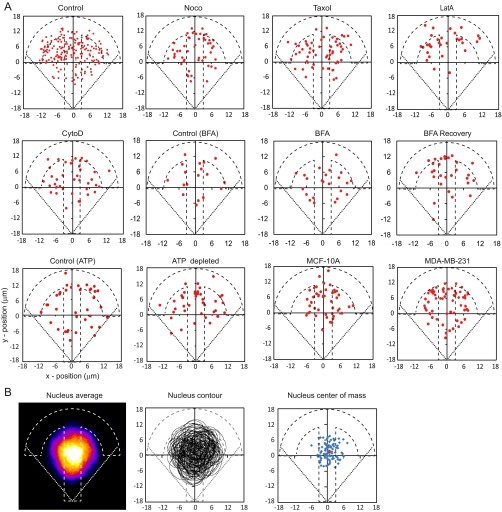
Fig. S1.
(A) Distribution of the beads location inside RPE1 cells plated on crossbow-shaped adhesive micropatterns in the different experimental conditions used in the study and inside nontumorigenic MCF-10A breast cells and metastatic MDA-MB-231 breast cancer cells (n = 166, 49, 62, 32, and 39 for control RPE1 cells, nocodazole-, Taxol-, latrunculin A (LatA)-, and cytochalasin D (CytoD)-treated RPE1 cells, respectively; n = 19, 24, and 28 for control cells, BFA-treated cells, and after recovery from BFA treatment; n = 38 for both control and ATP-depleted cells; n = 46 and 62 for MCF-10A and MDA-MB-231 cells). (B) Nucleus positioning in micropatterned RPE1 cells. The heat map shows the averaged nuclear (DAPI) staining from n = 89 cells (Left). The corresponding nucleus contours and centers of mass are shown in the Middle and Right. The red dot in the center of mass map corresponds to the average position of the nucleus center of mass.

