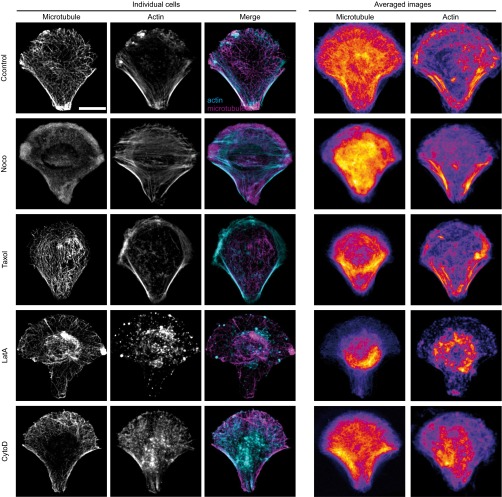
Fig. S4.
Immunofluorescence images of microtubules and actin in individual fixed cells (Left) or averaged (Right) in RPE1 control cells or in cells treated with the indicated drug destabilizing the microtubule or the actin cytoskeleton. The merged images of individual cells show actin in cyan and microtubules in magenta. Note that the fire look-up table used to display the averaged images is scaled between the minimum and the maximum intensity levels to highlight intensity variations. Averaged images are from n = 26, 21, 18, 17, and 17 cells for control RPE1 cells or nocodazole-, Taxol-, latrunculin A (LatA)-, and cytochalasin D (CytoD)-treated RPE1 cells, respectively. (Scale bar, 10 μm.)

