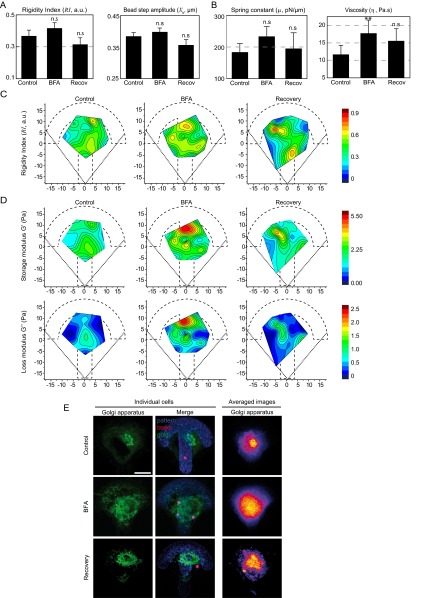
Fig. S7.
Contribution of internal membranes to the spatial variations in intracellular mechanics. (A and B) Average values of the model-independent rigidity index and bead step amplitude (A) and of the spring constant and the viscosity obtained with the SLL model (B) in control cells, cells treated with BFA, and after recovery from BFA treatment. **P < 0.001. (C and D) Maps showing the distribution of the rigidity index (C) and of the storage modulus G′ and the loss modulus G″ obtained with the PL model (D) in control cells, in cells treated with BFA, and after recovery from BFA treatment. (E) Left panels show immunofluorescence images of the Golgi apparatus in individual cells labeled with BodipyFL-ceramide in RPE1 control cells, in cells treated with BFA, or after recovery from BFA treatment. The merged images show the Golgi apparatus in green, the micropattern in blue, and the beads in red. Right panels show averaged images of the Golgi apparatus stained with an anti-GM130 antibody. Averaged images are from n = 26, 17, and 8 cells for control RPE1 cells, BFA-treated cells, and after recovery from BFA treatment, respectively. (Scale bar, 10 μm.)

