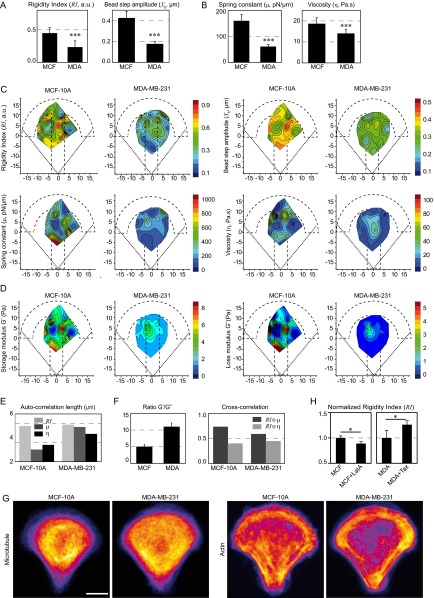
Fig. S9.
Metastatic breast cancer cells are softer than nontumorigenic cells and exhibit a different distribution of intracellular viscoelasticity. (A and B) Average values of the model-independent rigidity index and bead step amplitude (A) and of the spring constant and the viscosity obtained with the SLL model (B) in nontumorigenic MCF-10A breast cells and in metastatic MDA-MB-231 breast cancer cells. ***P < 0.0001. (C and D) Maps showing the distribution of the rigidity index and the bead step amplitude (C, Top), the distribution of the spring constant and the viscosity obtained with the SLL model (C, Bottom) and the distribution of the storage modulus G′ and the loss modulus G″ obtained with the PL model (D) in MCF-10A and in MDA-MB-231 cells. Data were obtained from n = 43 and 54 beads in MCF-10A cells and in MDA-MB-231 cells, respectively. (E) Autocorrelation lengths of the rigidity index, the spring constant, and the viscosity maps. (F) Relative contributions of elastic storage and viscous loss to the global rigidity of the cytoplasm evaluated by calculating the averaged ratios between G′ and G″ obtained by the PL analysis (Left) or by cross-correlating the rigidity map with the spring constant map or the viscosity map in each cell type (Right). (G) Averaged immunofluorescence images of the microtubule and actin cytoskeletons in MCF-10A and in MDA-MB-231 cells from n = 10 cells for MCF-10A and for MDA-MB-231 cells. (Scale bar, 10 μm.) (H) Average values of the rigidity index in MCF-10A cells treated or not with latrunculin A (LatA) and in MDA-MB-231 cells treated or not with Taxol (Tax). Data were normalized by their respective controls and were obtained from n = 32, 31, 20, and 47 beads in control MCF-10A cells, MCF-10A cells treated with LatA, control MDA-MB-231 cells, and MDA-MB-231 cells treated with Taxol, respectively. *P < 0.05.

