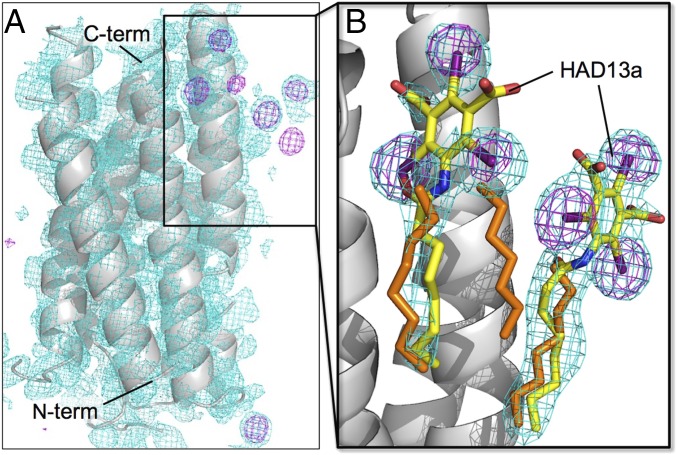
Fig. 3.
I-SAD phasing of bR with HAD13a. (A) Initial overall structure (gray ribbon model) with experimental map (cyan mesh; contoured at 1.0 σ) after SHELXE with density modification and polyalanine autotracing. Anomalous difference maps (purple mesh; 4.0 σ) are also shown. (B) Close-up view of the HAD13a binding site in the final refined structure with 2mFo–DFc maps (cyan mesh; 1.0 σ). The C, N, O, and I atoms of HAD13a (stick models) are colored yellow, blue, red, and purple, respectively. Alkyl chains derived from native lipid or DMPC/CHAPSO bicelles are depicted as orange stick models.

