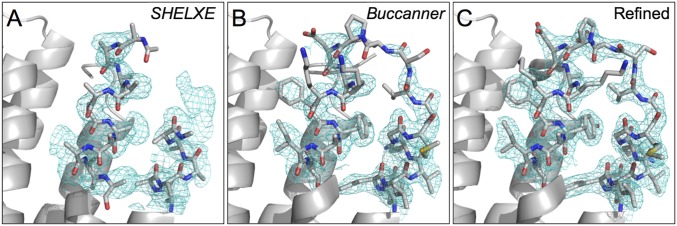
Fig. 4.
Improvement of electron density maps (cyan mesh; contoured at 1.0 σ) and models around residues 26–46 of bR from the various steps of the I-SAD phasing process: (A) SHELXE model and experimental map after density modification and polyalanine autotracing, (B) Buccaneer model and 2mFo–DFc map after automatic model building, and (C) the final refined model and 2mFo–DFc map. The C, N, O, and S atoms in stick models are colored gray, blue, red, and yellow, respectively.

