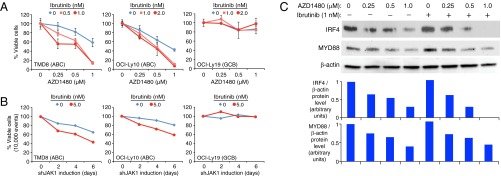
Fig. 5.
Synergy of JAK1 inhibition and ibrutinib in killing of ABC DLBCL cells. (A) The indicated DLBCL lines were treated with the indicated concentrations of AZD1480 and/or ibrutinib for 6 d and evaluated for viability by trypan blue dye exclusion. Both drugs were replenished on day 3. Error bars represent mean ± SD of triplicates. The GCB DLBCL cell line OCI-Ly19 served as a negative control cell line. Data are normalized to toxicity of treatment with the indicated concentrations of ibrutinib alone. A shift of the AZD1480 toxicity curves to the left indicates a greater than additive effect of the two drugs. (B) Ibrutinib increases JAK1 shRNA toxicity in TMD8 and OCI-Ly10 cells. Flow cytometric analysis of the percentage of viable, shJAK1-expressing cells in the presence of 5 nM ibrutinib or DMSO. (C) Immunoblot analysis of the indicated proteins in OCI-Ly10 ABC DLBCL cells after 48 h of treatment with the indicated concentrations of AZD1480 ± 1 nM ibrutinib. Shown below are IRF4 and MYD88 protein levels relative to β-actin levels as quantified by densitometry.

