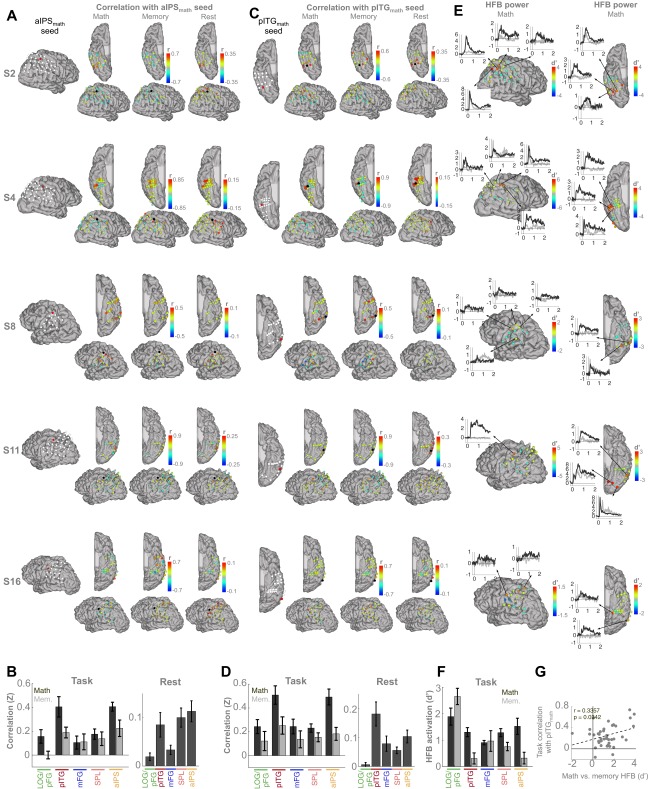
Fig. S6.
(A) In each of five subjects with simultaneous pITGmath and aIPSmath coverage, we show the trial-by-trial HFB correlation between the aIPSmath seed (Left) and all VTC and LPC electrodes during math trials (second from Left), memory trials (third from Left), and at rest (correlations of slow fluctuations in HFB activity) (Right). (B) Average correlation (Fisher-z) between the aIPSmath seed and different VTC and LPC subregions, during math and memory trials (Left) and at rest (Right) across the five subjects. Only electrodes with a significant HFB math response are considered in the bar plots; therefore only subregions with a large number of significantly activated electrodes are included. (C) Trial-by-trial HFB correlation between the pITGmath seed (Left) and all VTC and LPC electrodes during math trials (Second from Left), memory trials (third from Left), and at rest (correlations of slow fluctuations in HFB activity) (Right). (D) Average correlation (Fisher-z) between the pITGmath seed and different VTC and LPC subregions during math and memory trials (Left) and at rest (Right). (E) HFB math activation (relative to baseline, d′) at all LPC and VTC electrodes in each subject along with HFB time courses during both math and memory trials at several electrodes of interest. (F) Average HFB activation (vs. baseline) within each VTC and LPC subregion, separately during math and memory trials, across the five subjects. (G) The relationship between the selectivity of each LPC electrode (math vs. memory HFB) and its correlation with the pITGmath seed. Only electrodes with a significant HFB math response are included.

