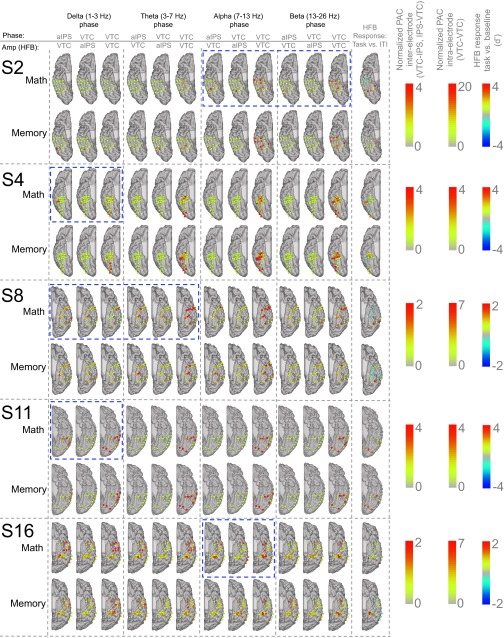
Fig. S7.
PAC between an aIPSmath seed and sites in the VTC is shown for the five subjects with simultaneous pITGmath and aIPSmath coverage, using four different frequency bands for phase, and separately during math and memory trials in task 2. For each subject/frequency, PAC is shown from the VTC to the aIPSmath, from the aIPSmath to the VTC, and from the VTC to the VTC (within-electrode). In the far right column the HFB response of each VTC electrode during math trials and memory trials (relative to baseline, d′) is shown. The blue dashed outlines highlight the approximate preferred coupling frequency of the aIPSmath site in each subject.

