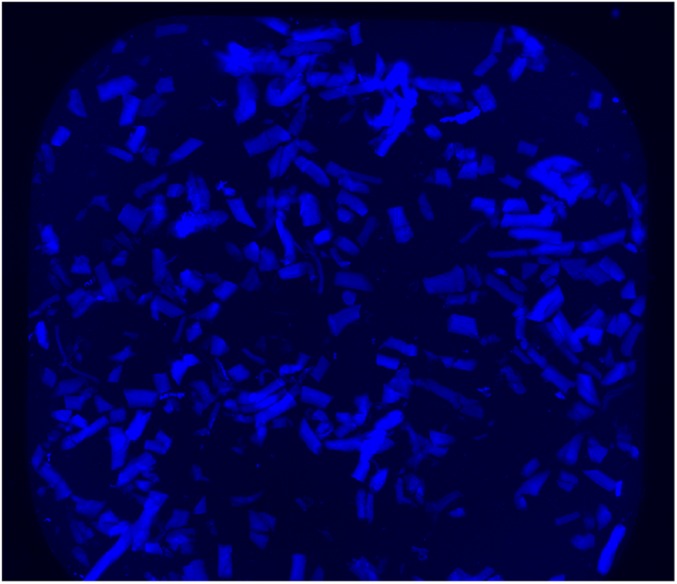
Fig. S1.

Image of one of the wells, showing the chopped, skinned fibers labeled with MDCC. The fiber suspension was pipetted into a well in a 384-well plate, and the fibers were allowed to settle to the bottom of the well. The well was imaged using epifluorescence with a Nikon 6D microscope. The fluorescence intensity of the fibers was then quantitated by a macro and used to measure the population of myosin heads in the SRX.
