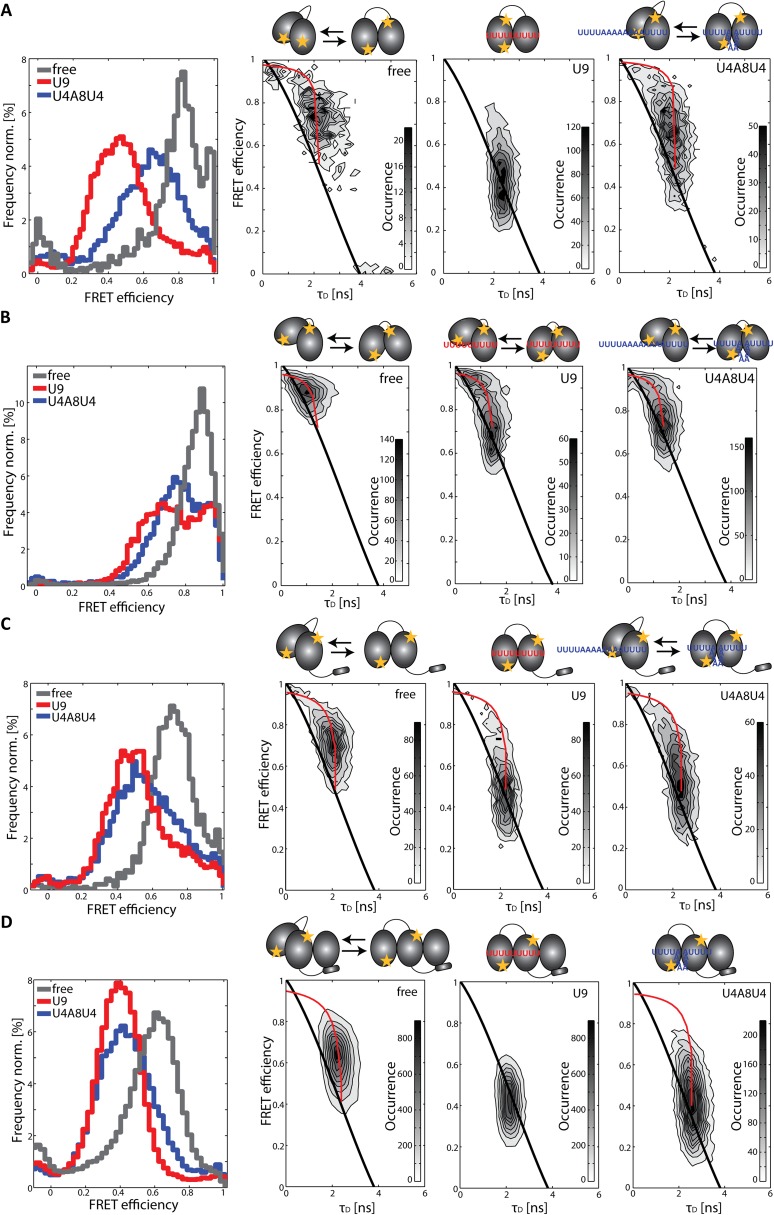
Fig. S3.
Conformational dynamics of RRM1,2 constructs measured in solution on a confocal microscope equipped with MFD-PIE. First column shows FRET efficiency histograms, and the second through fourth columns show 2D histograms of FRET efficiency versus donor lifetime of (A) RRM1,2-C187-C318, (B) RRM1,2-Δ233–252-C187-C318, (C) URRM1,2-C187-C326, and (D) URRM1,2-C187-C326/U2AF35(UHM) alone (gray), in the presence of the strong Py-tract U9 (red), and in the presence of the weak binding sequence U4A8U4 (blue). Histograms of spFRET efficiency versus donor lifetime of the constructs are shown in the absence of RNA (second column), when bound to U9 (third column), and when bound to U4A8U4 (fourth column). Populations of static molecules in the 2D histograms are described by the polynomial static FRET line (Eq. S5; black line), whereas molecules undergoing conformational dynamics on the time scale of microseconds to milliseconds deviate from this line (dynamic FRET curve in Eq. S7; red line). The fully open and closed conformations were determined from lifetime fits of the data and correspond to the intersections of the dynamic FRET curve with the static FRET line. Schematic representations of the constructs transversing between the closed and the open conformation in the absence and presence of RNA are shown above the respective plots.

