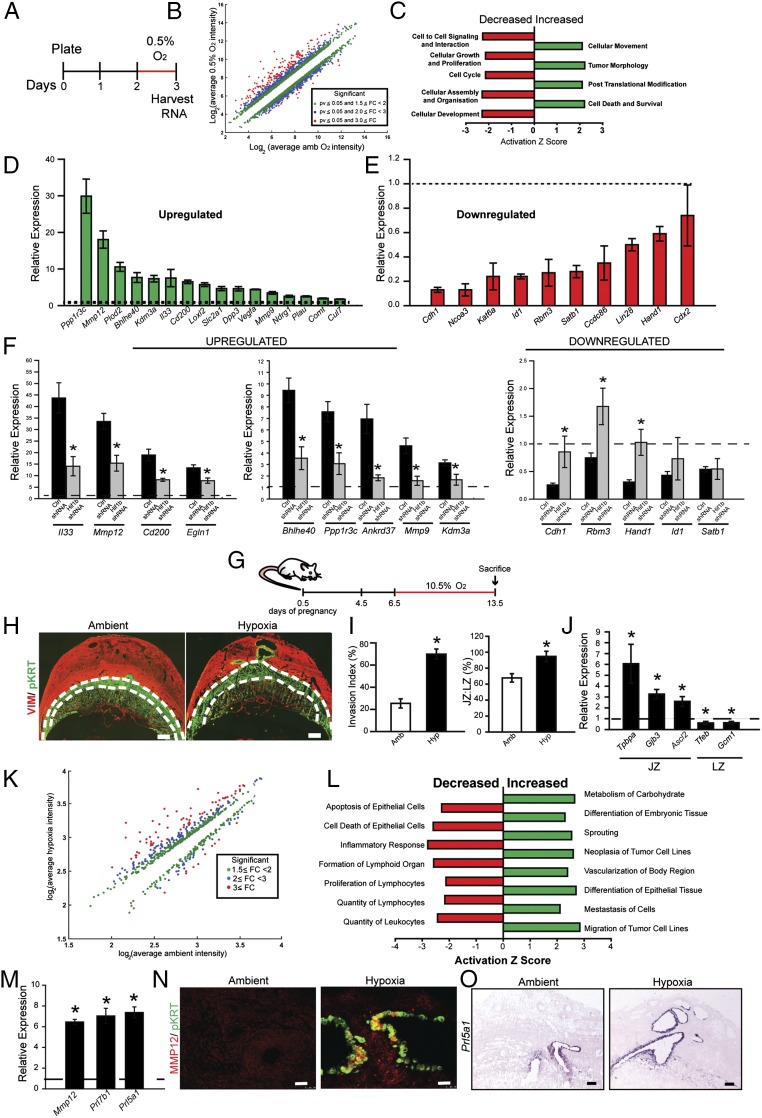
Fig. 1.
Hypoxia-dependent responses of TS cells and the placentation site. (A) Schematic representation of TS cell exposure to low oxygen tension (0.5% O2 for 24 h) before harvesting RNA for DNA microarray analysis. (B) Scatter plot presentation of in vitro hypoxia-responsive transcripts. (C) Presentation of pathway analysis of transcripts differentially expressed following TS cell exposure to 0.5% O2. (D and E) Validation of select differentially expressed transcripts by qRT-PCR. All hypoxia responses are significantly different from ambient control (n = 5/group; P < 0.05). (F) Examination of the dependence of hypoxia-dependent transcript changes on HIF signaling. TS cells were exposed to 0.5% O2 in the presence of control (Ctrl) or Hif1b shRNAs. RNA was harvested and transcript levels assessed by qRT-PCR (n = 4/group; ANOVA with Student–Newman–Keuls test, *P < 0.05). Dashed lines represent the ambient control values. (G) Schematic representation of in vivo maternal exposure to hypoxia (10.5% O2). (H) Representative cross sections of gd 13.5 placentation sites immunostained for vimentin and cytokeratin from pregnant rats exposed to ambient (Amb) or hypoxia (Hyp, 10.5% O2). The junctional zone (devoid of vimentin staining) is demarcated by the dashed white lines. (Scale bar, 1 mm.) (I) Quantification of invasion of trophoblast cells into the uterine mesometrial compartment and ratio of junctional and labyrinth zones (ambient, n = 10; hypoxia, n = 12; *P < 0.05). (J) Relative expression of transcripts associated with the junctional zone (JZ) and labyrinth zone (LZ) (n = 8/group, *P < 0.05). Dashed lines represent the ambient control values. (K) Scatter plot presentation of maternal hypoxia-responsive transcripts in the metrial gland. (L) Presentation of pathway analysis of differentially expressed transcripts in the metrial glands following hypoxia exposure. (M) Validation of selected differentially expressed transcripts by qRT-PCR (n = 10/group, *P < 0.05). Dashed lines represent the ambient control values. (N) Immunohistochemical analysis of MMP12 and pan cytokeratin (pKRT) staining in tissue sections from pregnant rats exposed to ambient or hypoxia conditions. (Scale bar, 50 μm.) (O) In situ hybridization analysis of Prl5a1 transcripts in placentation sites from pregnant rats exposed to ambient or hypoxia conditions. (Scale bar, 250 μm.) Data presented in D–F, I, J, and M were analyzed with Mann–Whitney test.

