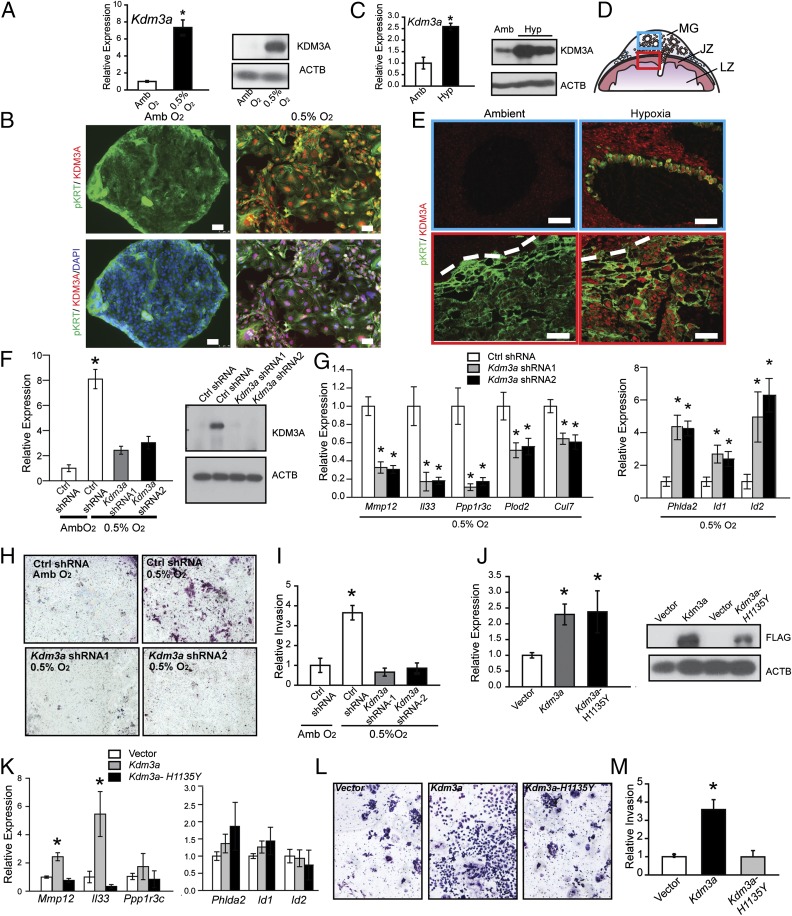
Fig. 3.
KDM3A and hypoxia signaling in trophoblast cells. (A) Kdm3a transcript (qRT-PCR; Left) and protein (Western blot; Right) responses in TS cells cultured under ambient (Amb) or low oxygen (0.5% O2). Statistical analysis: n = 5/group, Mann–Whitney test, *P < 0.05. (B) Immunocytochemical staining for pan-cytokeratin (pKRT) and KDM3A in TS cells cultured under Amb or 0.5% O2. (Scale bar, 50 µm.) (C) In vivo placental Kdm3a transcript (qRT-PCR; Left) and protein (Western blot; Right) responses to maternal hypoxia (10.5% O2 from gd 6.5 to 13.5). (D) Schematic representation of a midgestation placentation site, consisting of the metrial gland (MG), junctional zone (JZ), and labyrinth zone (LZ). The blue box corresponds to the metrial gland region (Upper) of E and the red box corresponds to the junctional zone (Lower) of E. (E) Immunohistochemistry analysis (pan cytokeratin, pKRT; KDM3A) of gd 13.5 placentation site sections from pregnant rats exposed to ambient and hypoxic conditions. The dashed line in the bottom panels represents the border between the decidua and chorioallantoic placenta. (Scale bar, 100 µm.) (F) qRT-PCR and Western blot validation of Kdm3a shRNAs. TS cells expressing control (Ctrl) or Kdm3a shRNAs were examined in Amb or 0.5% O2 culture conditions (n = 4, *P < 0.05). (G) Effects of Kdm3a knockdown on hypoxia responsive transcripts in TS cells (n = 4, *P < 0.05). (H) Effects of Kdm3a knockdown on 0.5% O2 activated invasive behavior of TS cells. Images are representative filters. (I) Quantification of invasion through Matrigel (n = 3, Ctrl shRNA + 0.5% O2 vs. all other treatments, *P < 0.05). (J) Ectopic transcript (qRT-PCR; Left) and protein (Western blot, Right) expression of control (vector) and WT (Kdm3a) and mutant (Kdm3a-H1135Y) Kdm3a constructs stably transfected into TS cells. (K) Effects of ectopic expression of control (vector), WT (Kdm3a), and mutant Kdm3a (Kdm3a-H1135Y) constructs stably transfected into TS cells on hypoxia responsive transcripts (n = 4, Kdm3a vs. vector or Kdm3a-H1135Y, *P < 0.05). (L) Effects of ectopic expression of control (vector), WT (Kdm3a), and mutant Kdm3a (Kdm3a-H1135Y) constructs stably transfected into TS cells on invasive behavior. Images are representative filters. (M) Quantification of invasion through Matrigel (n = 4, Kdm3a vs. vector or Kdm3a-H1135Y, *P < 0.05). Data presented in F, G, I–K, and M were analyzed with ANOVA and Student–Keuls test. ACTB was used as a loading control for the Western blots shown in A, C, F, and J.

