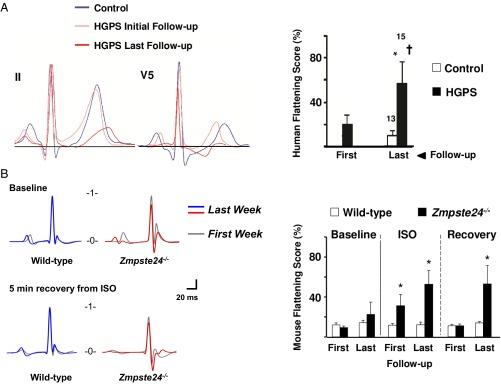
Fig. 1.
Age-related exacerbation of repolarization abnormalities in HGPS patients and Zmpste24−/− mice. (A, Left) Extracted averaged ECG leads II and V5 from human control participants (blue traces) and HGPS patients at initial stage (Initial; light red trace) and advanced stages (Last; dark red trace). (A, Right) Quantification of mean flattening scores. (B, Left) Representative T-wave abnormalities in Zmpste24−/− mice comparing the first and the last isoproterenol (ISO) challenge (SI Appendix, SI Materials and Methods). (B, Right) Mean effective flattening scores at baseline, after ISO exposure and during 5-min recovery. *P < 0.05 vs. control; †P < 0.05 vs. first follow-up. First: 11-wk-old mice; Last: 19-wk-old mice or last week before death.

