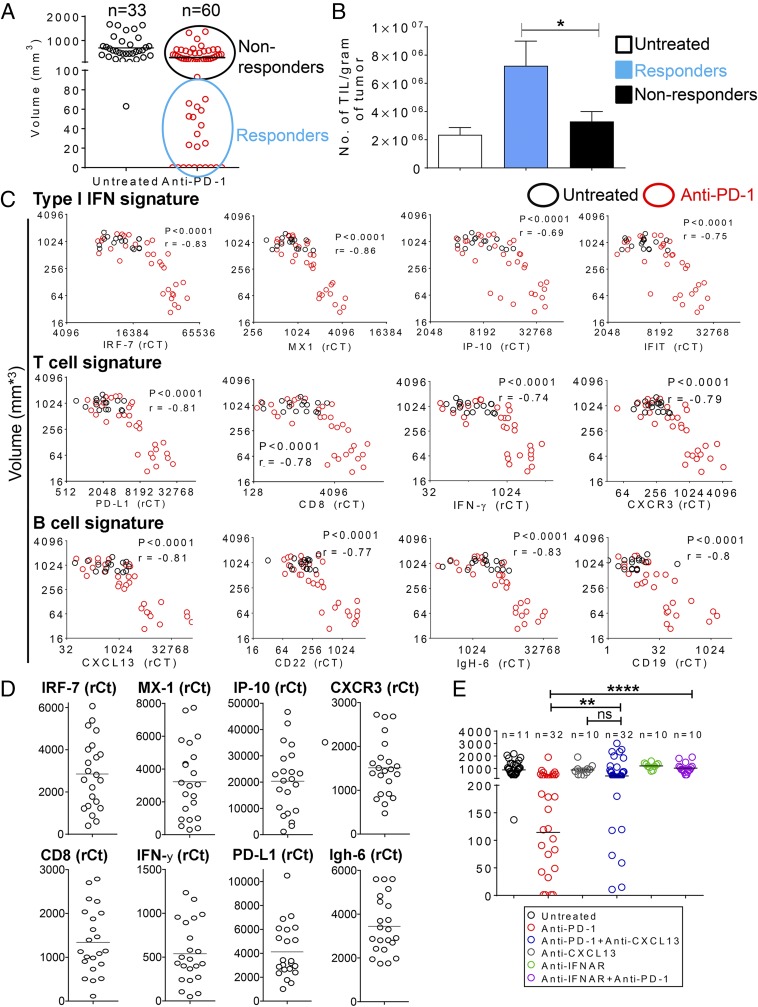
Fig. 1.
Mice bearing CT26 tumor nodules produce a heterogeneous response to systemic PD-1 blockade. (A) Distribution of tumor nodule sizes after five anti–PD-1 injections. CT26 cells were injected s.c. at day 0 on both flanks. Anti–PD-1 was administered i.p. on days 5, 8, 11, 14, and 18. Tumor volumes were measured 4 d after the last injection. Data are pooled from two independent experiments. (B) Density of TILs in subset of tumors from A. Shown is the mean ± SEM based on: four untreated mice, seven anti–PD-1 nonresponders, and nine anti–PD-1 responders. *P ≤ 0.05. (C) Response to anti–PD-1 correlates with type I IFN and T- and B-cell gene signatures. Tumors were harvested 4 d after the last anti–PD-1 injection, and gene expression was measured by TAQMAN gene expression. Cumulative data are from five independent experiments, with a total number of 16 in the untreated group and 32 in the anti–PD-1 group. Spearman’s ρ was used to calculate the correlation between gene expression levels and tumor volumes. All statistical tests were two-sided, and P values ≤0.05 were considered significant. (D) Heterogeneity of IFN-regulated genes and T-cell and B-cell signature gene expression in early-established s.c. tumors. CT26 cells were injected s.c. at day 0 on both flanks, and tumors were harvested 7 d later for TAQMAN analysis. Data are pooled from two independent experiments (n = 22). (E) Volume distribution of tumors following anti–PD-1 blockade in the absence or presence of the interferon-α/β receptor (IFNAR) blocking Ab or CXCL13 blocking Ab. CT26 cells were injected s.c. at day 0 on both flanks. Anti–PD-1 blocking antibody was administered on days 8, 11, 13, 18, and 20. Tumor volume was measured 4 d after the last injection, at day 24. Data are pooled from two independent experiments. **P ≤ 0.01; ****P ≤ 0.0001.

