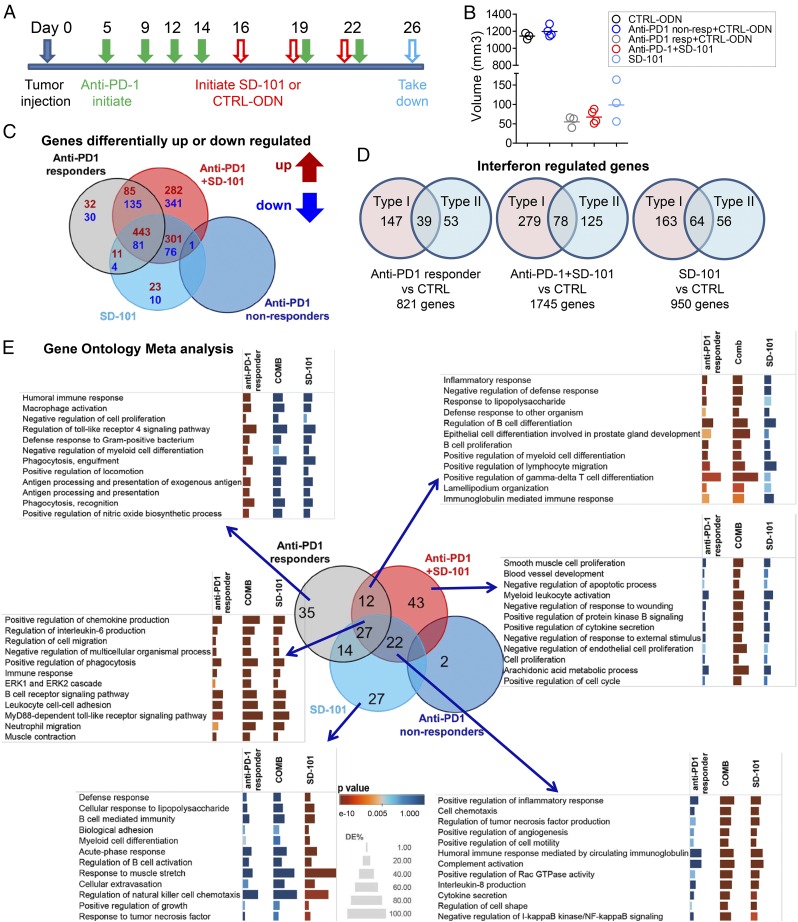
Fig. 4.
Microarray analysis of tumors treated by anti–PD-1, SD-101, or the combination of anti–PD-1 and SD-101. (A) Treatment schedule scheme for microarray tumor samples: Anti–PD-1 treatment started 5 d after tumor cell inoculation. After four anti–PD-1 injections, mice were randomized and received three intratumoral injections of SD-101 or CTRL-ODN, with or without another two anti–PD-1 injections. A separate group of mice with the same tumor size but no pretreatment of anti–PD-1 started receiving SD-101 alone. SD-101 and CTRL-ODN were given every 3 d. Tumors were harvested 4 d after the last SD-101 or CTRL-ODN injection. (B). Mean volumes of tumor samples tested by gene expression microarray. Each sample is a pool of two to three tumors. Cumulative data from two independent experiments are shown. (C). Addition of SD-101 to anti–PD-1 expanded the Venn diagram of DEG (defined as ≥twofold difference in expression and a P value of <0.05) in tumors from all treatment groups versus tumors from CTRL-ODN–treated mice. Diagram was constructed using iPathway software. (D) Type I and type II IFN regulated genes in each contrast identified by Interferome database. Each contrast is the relative gene levels to the CTRL-ODN–treated group. (E) Venn diagram showing the overlap of the GO terms retrieved from term enrichment analysis performed using iPathway software; cut-off P value for selection of GO terms, P < 0.005. The fraction of DEG significance for selected immune-related GO terms was visualized by Tableau software. Enrichment significance is conveyed as bar color intensity. Height of the bar is proportional to the number of DEG in the GO terms. The P value is computed by iPathway software using hypergeometric distribution and is corrected using weight pruning.

