
Fig. 2. Dynamic equilibrium of receptor dimerization observed at the single-molecule level.
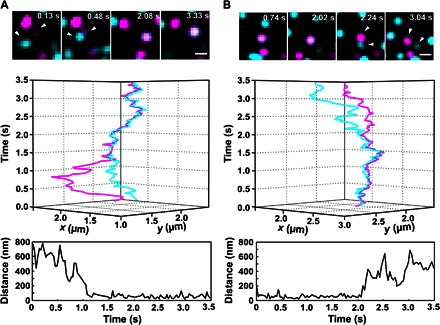
Assembly (A) and dissociation (B) of individual IFNAR1 (cyan) and IFNAR2 (magenta) heterodimers observed in the presence of IFNα2: time series of images (top), 3D trajectories (middle), and distances between receptors as a function of time (bottom). White arrowheads mark the dimerized receptors. Scale bars, 1 μm.