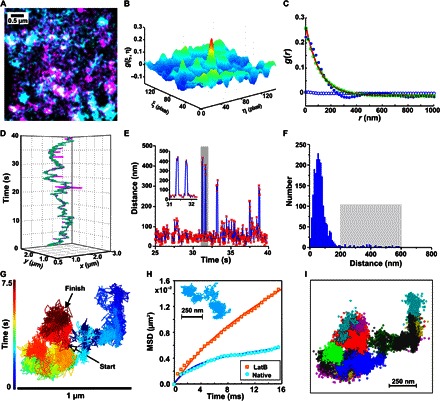
Fig. 5. Secondary compartmentalization of IFNAR complexes.

(A to C) Identification of secondary confinement zones by dual-color TALM and pcTALM. (A) TALM images of IFNAR1 (cyan) and IFNAR2 (magenta) in the presence of IFNα2. (B) Image cross-correlation and (C) pair correlation analyses. The pair correlation curve (blue dots) was deconvolved into the contributions of free (blue circles) and confined (green circles) diffusion components by fitting Eq. 3 (Materials and Methods). (D to F) Transient dissociation events observed within experimental colocomotion trajectories. (D) Localizations of IFNAR1 (cyan) and IFNAR2 (magenta) within an individual colocomotion trajectory. (E) IFNAR1-IFNAR2 distance map within an individual cotrajectory (red dots connected by a blue line) showing dissociation and reassociation events within secondary confinement dimensions. Two characteristic dissociation events highlighted by the gray bar are enlarged in the inset. (F) Histogram of IFNAR1-IFNAR2 distances yielding a significant fraction (2.3%) of distances of >200 nm, which correspond to transient dissociation events (highlighted by the gray rectangle). The total number of displacements N = 1560 was obtained from 24 trajectories yielding an average of 1.5 reassociation events per trajectory. (G and H) Detection of secondary confinement zones by fast QD tracking. (G) Trajectory of an individual particle covering 15,000 frames. Color coding according to the acquisition time indicated by the time bar. (H) MSD analysis of fast QD tracking in native cells and after the addition of LatB. A typical trajectory from native cells is shown in the inset. MSD data obtained from more than 1000 trajectories. (I) Identification of domains (depicted in different colors) by DBSCAN analysis.
