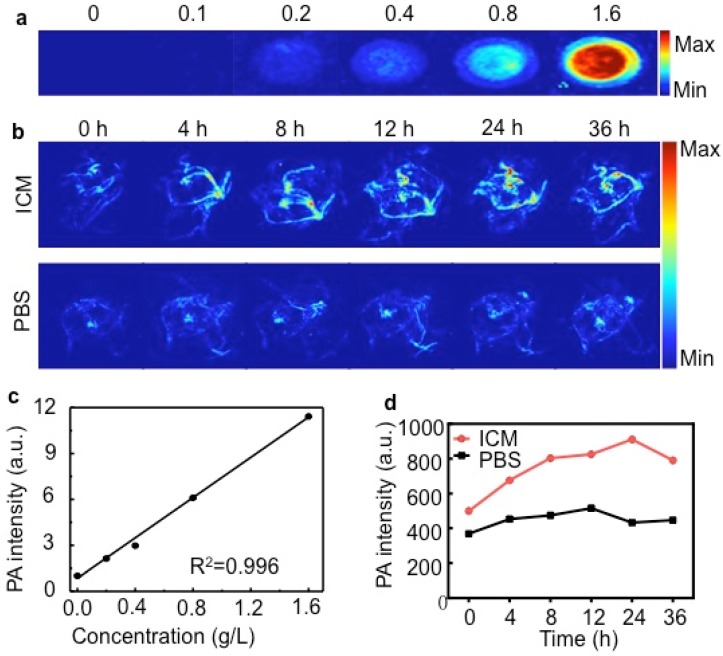
Figure 5.
(A) PA images of ICM at different concentrations (g/L). (B) PA MAP images obtained for mice after intravenous injections of IR-780 micelles or PBS (C) PA intensity as a function of ICM at different concentrations. (D) Corresponding PA intensity of ICM and PBS buffer in tumor sites at different time points.

