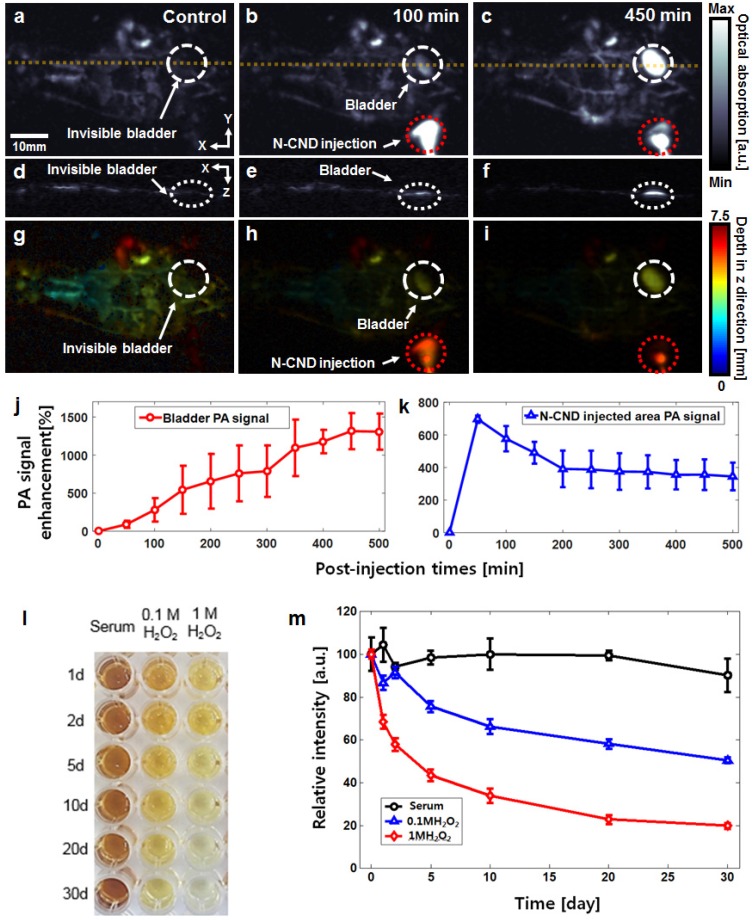
Figure 4.
In vivo photoacoustic (PA) bladder imaging and degradation test using N-CNDs. (a) Coronal (front) PA maximum amplitude projection (MAP) image before N-CNDs injection. (b) and (c) Coronal PA MAP image after 100 min and 450 min of N-CNDs injection. (d-f) Corresponding PA B-mode images at the dashed line region of (a-c). (g-i) Corresponding depth-encoded PA MAP images of the PA MAP images of (a-c). (j) and (k) PA signal profile in the bladder region (white dashed circle in (a-c)) and injected area (red dashed circle in (a-c)) from before injection to 500 min after the N-CNDs injection. (l) and (m) Serum biochemistry assay of N-CNDs-injected mice.

