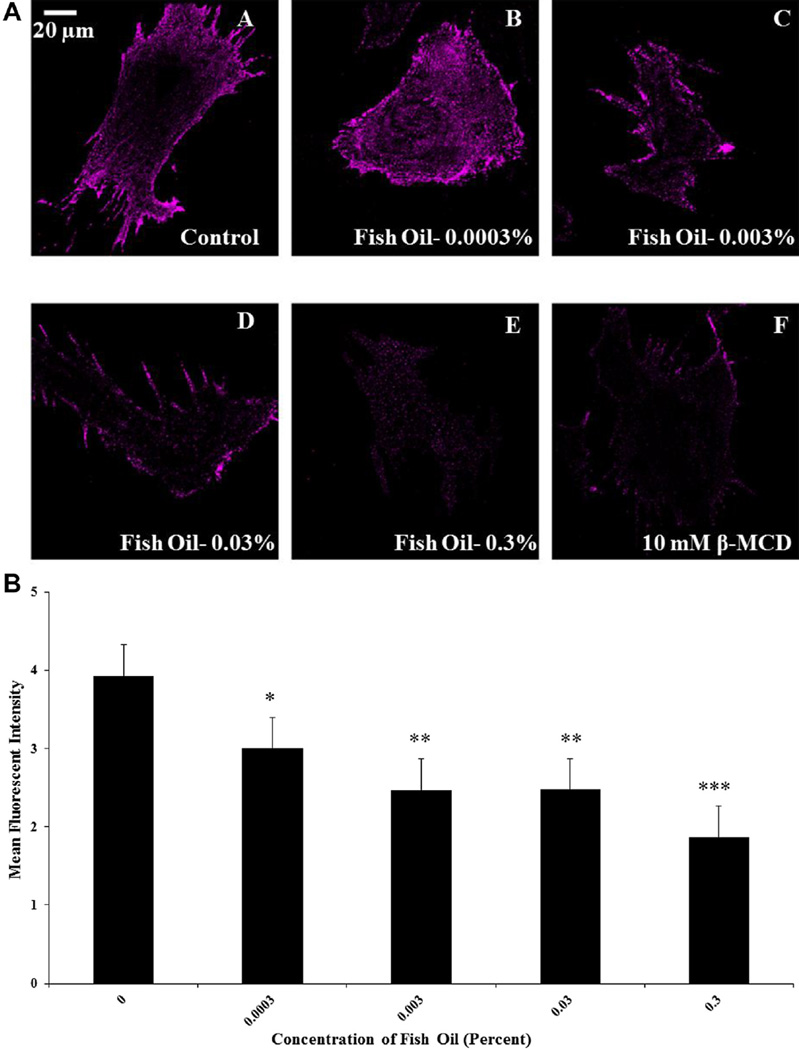
Fig. 1.
Effects of fish oil on spatial distribution of lipid microdomains. Panel A shows representative micrographs obtained from (A) control cells, (B) 0.0003% fish oil (vol/vol), (C) 0.003% fish oil (vol/vol), (D) 0.03% fish oil (vol/vol), (E) 0.3% fish oil (vol/vol), and (F) 10-mM beta-methylcyclodextrin (β-MCD). Panel B shows means of the fluorescent intensity for luteal cells obtained from control cells (n = 49), 0.0003% fish oil (vol/vol; n = 48), 0.003% fish oil (vol/vol; n = 48), 0.03% fish oil (vol/vol; n = 49), and 0.3% fish oil (vol/vol; n = 47); control vs fish oil; *P < 0.05; **P < 0.001; ***P < 0.0001.

