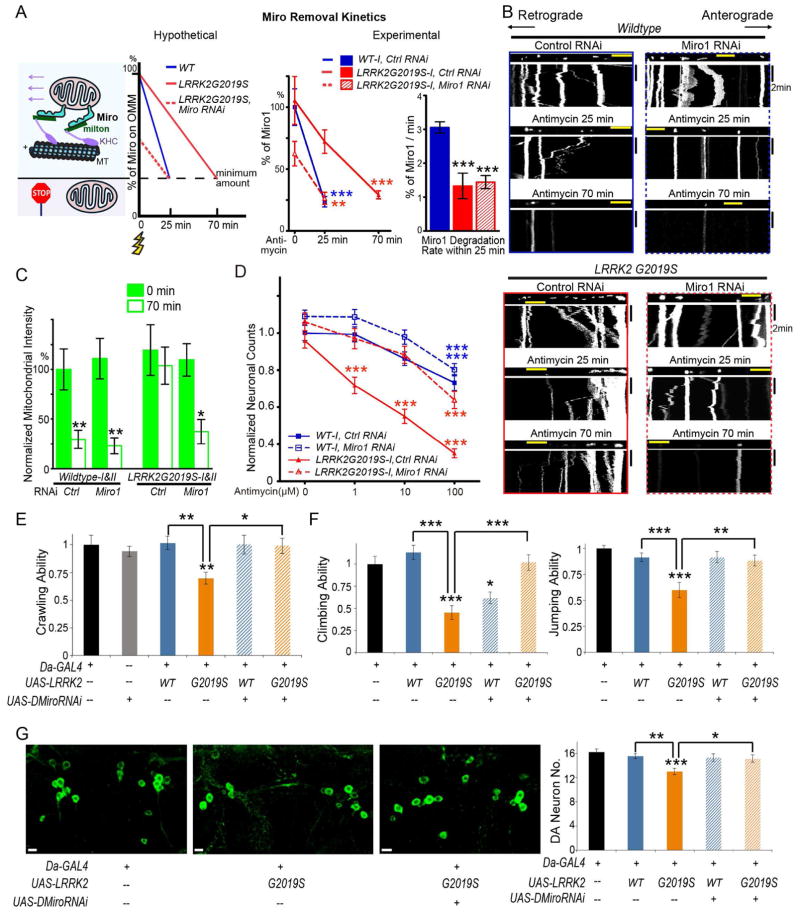
Figure 4. Miro RNAi Rescues Phenotypes of LRRK2G2019S IPSC-Derived Neurons and Flies.
(A) Schematic representation of Miro removal rates. The y-axis is the percent of total Miro protein levels on the OMM, and the x-axis is the time following depolarization (yellow flash sign). There is a hypothetical minimum amount of Miro on the OMM required for successfully anchoring mitochondria to motors and MT (microtubules) to enable movement. Note that the number of Miro protein on one mitochondrion drawn represents the relative protein amount rather than the actual number of the protein. In the experimental model, the Miro1 protein level is quantified in each condition using immunostaining as in Figure S5 expressed as a percentage of the mean of “Wildtype-I, control RNAi, 0 min”, or the degradation rate of Miro1 (%/min) is calculated within the first 25 min compared to “Wildtype-I, control RNAi”. n=93–151 neurons from 3 independent transfections. (B) Mitochondrial movement in representative axons transfected with mito-dsRed before and after treatment with 100 μM Antimycin A. The types of RNAi and genotypes are indicated. Quantification is in Figure S5C. (C) The normalized mitochondrial intensity is quantified as in Figure 2, expressed as a percent of the mean of “Wildtype, control RNAi, 0 min”. Comparisons with “Wildtype, control RNAi, 0 min”. n=10 axons from 10 separate transfections (pooled from Wildtype-I and II or from LRRK2G2019S-I and II). (D) Quantification of the number of surviving neurons as shown in Figure S6C. Each data point is from 60 fields from 3 independent transfections, expressed as a fraction of the mean of “Wildtype-I, control RNAi, 0 μM”. The densities of neurons before treatment were not significantly different among 4 genotypes (P=0.1071). (E) The crawling ability of third instar larvae with different genotypes is quantified, expressed as a fraction of the mean of the control “Da-GAL4”. n=17–30. (F) The climbing and jumping abilities of adult flies 20 days after eclosion are quantified, expressed as a fraction of the mean of “Da-GAL4”. n=44–60. (G) The PPM1/2 clusters of dopaminergic (DA) neurons visualized by anti-TH in adult brains 35 days after eclosion are shown. The number of DA neurons is quantified. n=11–20 brains. Comparisons with “Da-GAL4” unless otherwise indicated. Scale bars: (B) 10 μm; (G) 5 μm. See also Figures S5–S6, Table S2.

