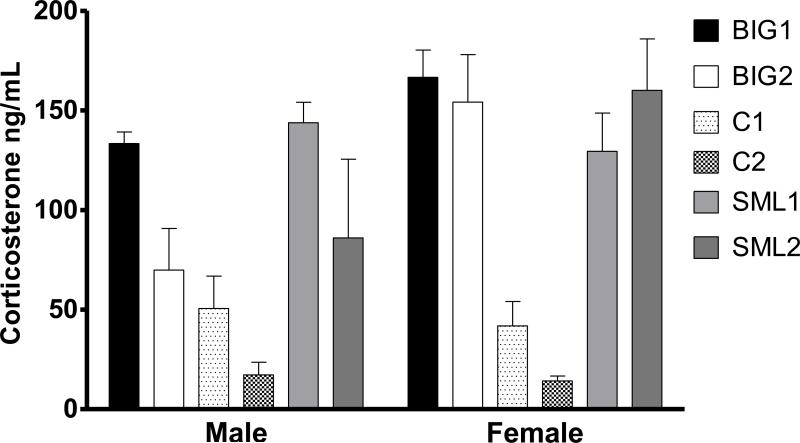
Figure 7. Plasma Corticosterone Levels.
Mean (± SEM) corticosterone levels as a measure of HPA axis stress response of male and female BIG, SMALL and Control replicate strains. Levels in male BIG1 and SML1 strains were significantly higher than the Control C2 strain (t=3.773, p<0.001 and t=4.385, p<0.001, respectively). BIG1 (t=2.455, p<0.05) and SML1 (t=2.916, p<0.05) males had higher corticosterone levels than C1 males. Female BIG1, BIG2, SML1 and SML2 also had higher corticosterone levels than female C1 (t=3.90, p<0.001; t=3.73, p<0.001; t=2.91, p<0.05 and t=4.91, p<0.001, respectively) and C2 (t=4.95, p<0.001; t=4.85, p<0.001; t=3.99, p<0.001 and t=5.30, p<0.001, respectively).

