Figure 5.
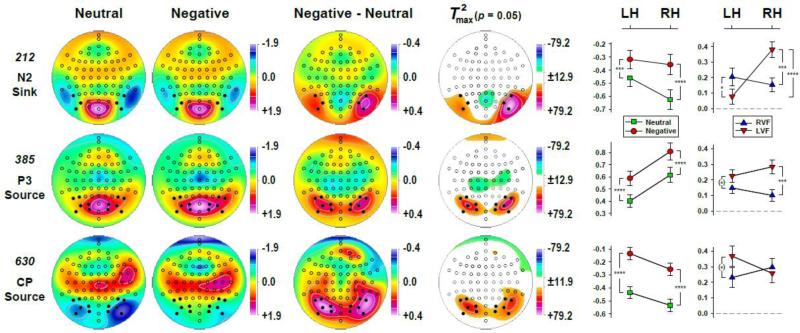
Statistical evaluation of topographic emotional content effects for PCA factors corresponding to N2 sink (212), P3 source (385) and a centroparietal (CP) source (630) using randomization tests for paired samples (N = 152; 10,000 repetitions). Shown are the mean factor score topographies for neutral and negative stimuli (pooled across visual field), the emotional content net effect (negative-minus-neutral), and squared univariate (channel-specific) paired samples T statistics thresholded at the 95th quantile (p = 0.05) of the corresponding randomization distribution (maximum of all 72-channel squared univariate paired samples T statistics). To facilitate comparisons of the max(T2) topographies with the underlying difference topographies, the sign of the difference at each site was applied to the respective T2 value, which is otherwise always positive. For each factor, symmetric scales were optimized for score ranges across neutral and negative stimuli; however, the same symmetric scale range was used across factors for the difference topographies and the max(T2) topographies to allow for better comparison of statistical effects across data transformations. All topographies are two-dimensional representations of spherical spline interpolations (m = 2; λ = 0) derived from the mean factors scores or T2 statistics available for each recording site. Line charts depict the mean (±SEM) factor score amplitudes over parietooccipital regions (sites marked as black dots) for negative (circles) and neutral (squares) stimuli at each hemisphere and of the emotional content net effect for each hemifield (triangles) at each hemisphere. Significant simple effects are marked as: (*) p < 0.10; * p < 0.05; *** p < 0.001; **** p < 0.0001.

