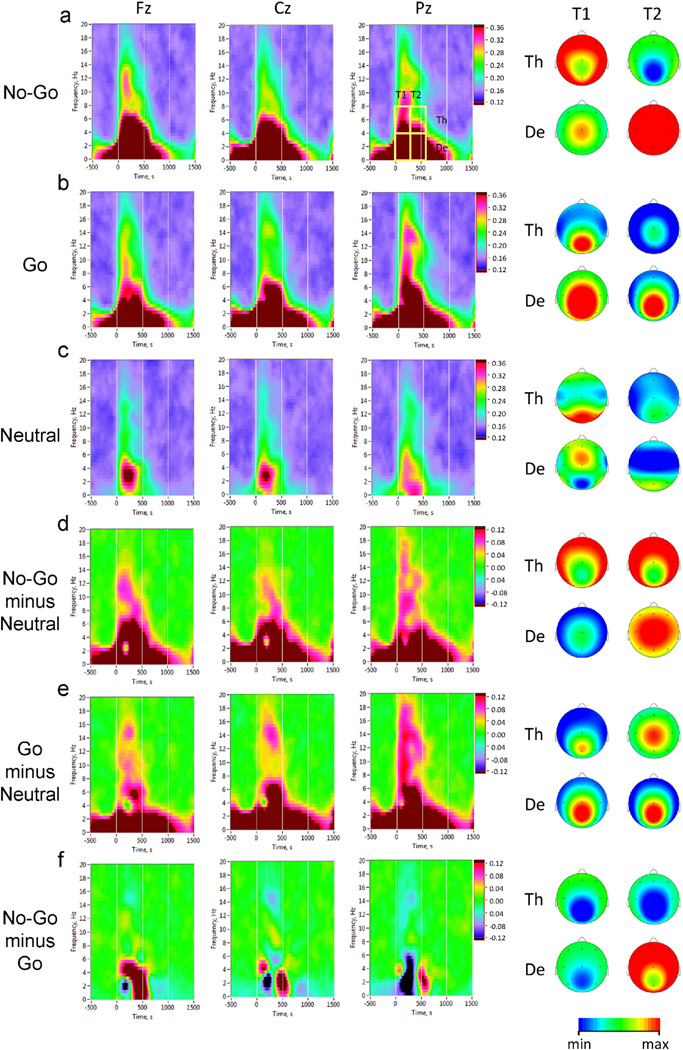
Fig. 3.
Inter-trial phase clustering in No-Go, Go, and Neutral task conditions. Averaged time-frequency distribution plots of Phase Locking Index (PLI) are shown for representative electrode locations: Fz (midline frontal), Cz (midline central), and Pz (midline parietal). Horizontal axis: time (ms), with zero value corresponding to stimulus onset; vertical axis: EEG oscillations frequency (Hz); phase locking is color coded, with warmer colors indicating higher degree of phase consistency across trials. For statistical analyses, average PLI-values were computed within four time-frequency regions of interest defined by two consecutive 300-ms time windows after the stimulus onset (T1 and T2) and two frequency bands (De = delta and Th = theta). Scalp topography maps of average PLI values within these regions are shown on the right. a: No-Go condition (brain maps are scaled: De, min = 0.40, max = 0.55; Th, min = 0.30, max = 0.36); b: Go condition (brain maps are scaled alike in a); c: Neutral condition (brain maps scaling: De, T1: min = 0.30, max = 0.32; De, T2: min = 0.26, max = 0.28; Th, T1: min = 0.24, max = 0.26; Th, T2: min= 0.20, max = 0.22); d: No-Go–Neutral difference (brain maps scaling: De, T1: min = 0.15, max = 0.30; De, T2: min = 0.25, max = 0.35; Th: min = 0.06, max = 0.12); e: Go–Neutral difference (scaling of brain maps the same as in d); f: No-Go–Go difference (brain maps scaling: De: min= −0.12, max= 0.12; Th: min= 0.0, max = 0.12).

