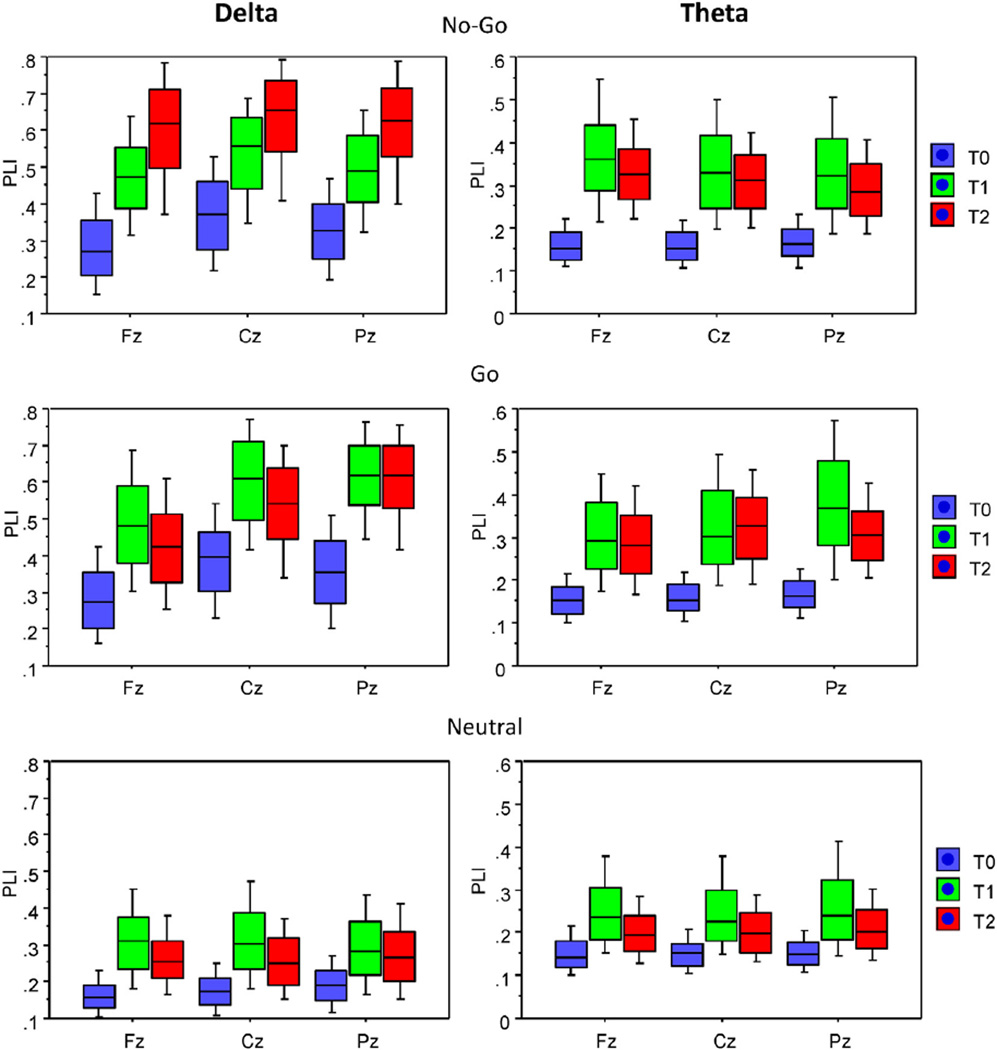
Fig. 4.
Box plots of average PLI values under the three task conditions (No-Go, Go, and Neutral) for three midline electrodes (Fz, Cz, and Pz) within the three time intervals before and after the stimulus onset. Box plots show10th, 25th, 50th (median), 75th and 90th percentiles of PLI values. Time intervals: T0 = −300–0 ms (baseline), T1 = 0–300 ms, and T2 = 300–600 ms.

