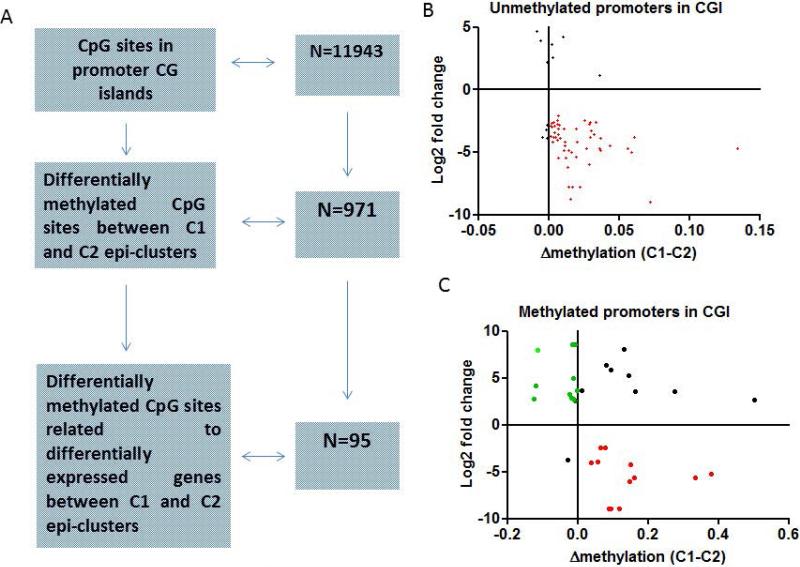
Figure 2.
A) Flow-chart showing the number of CG sites in promoter CG islands covered by DREAM and the number of differentially methylated CG between C1 and C2 epi-clusters. B) Correlation between differentially methylated CpG sites between C2 and C1 epi-clusters and gene expression changes. Herein, only unmethylated CpG sites (≤1%) of C2 epi-cluster located in promoter CG islands and both differentially methylated and expressed as compared to C1 epi-cluster are depicted. C) Correlation between differentially methylated CpG sites between C2 and C1 epi-clusters and gene expression changes. Herein, only methylated CpG sites (>1%) of C2 epi-cluster located in promoter CG islands and both differentially methylated and expressed as compared to C1 epi-cluster are depicted. Note that few of those methylated CG sites lost DNA methylation in C1 epi-cluster and become expressed (green), while the majority gains DNA methylation and get repressed.

