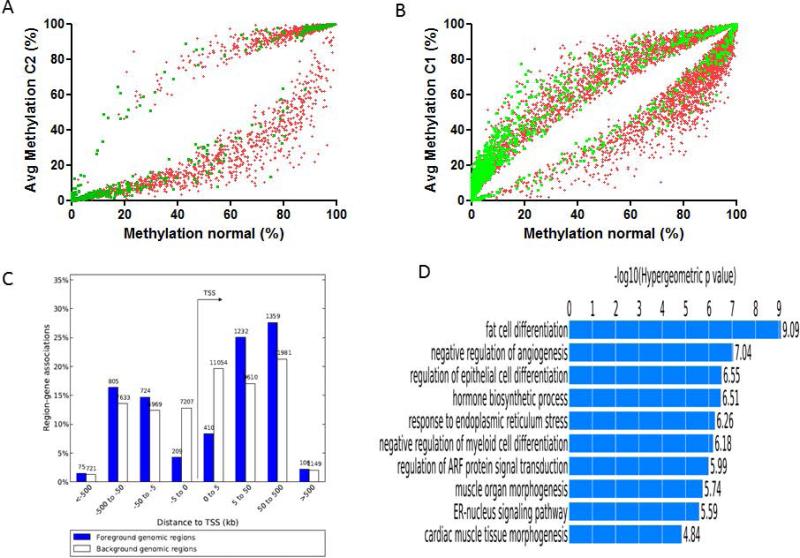
Figure 3.
A) Square graph of CpG sites (green: CpG islands; red: outside CpG islands) with statistically significant difference of DNA methylation between C2 epi-cluster and normal kidneys. Note the tendency toward global hypomethylation of C2 epi-cluster with almost no gain of DNA methylation in CGI. B) Square graph of CpG sites with statistically significant difference of DNA methylation between C1 epi-cluster and normal kidneys. Note the tendency toward both hypomethylation of CpG sites located outside CGI and hypermethylation of CpG sites in CGI. C) Distribution of differentially methylated CpG sites between C1 and C2 epi-clusters according to the distance from transcription start site (TSS) as assessed by GREAT tool. D) Gene Ontology functional annotations for differentially methylated regions between C1 and C2 epi-clusters as identified by GREAT tool.

