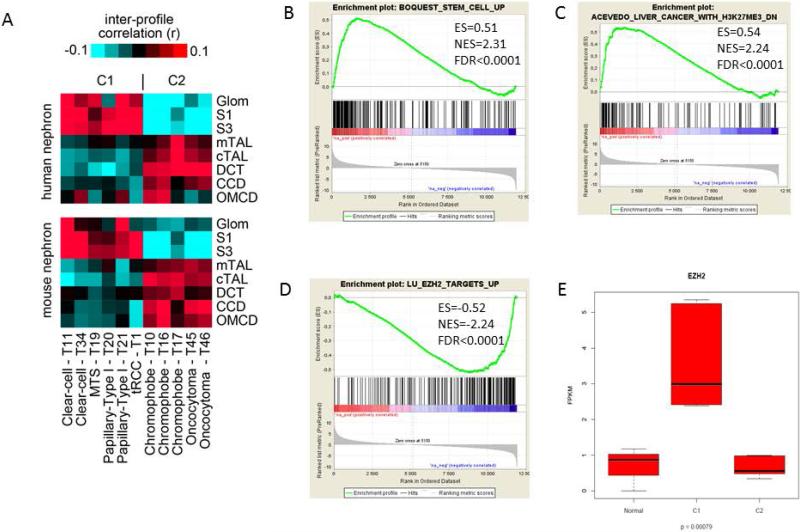
Figure 4.
A) Heat maps showing inter-sample correlations (red, positive) between mRNA profiles of RCC (columns) belonging to C1 and C2 epi-clusters and mRNA profiles of nephron anatomical sites (rows). Association of C1 and C2 epi-clusters expression patterns with those of specific regions of the nephron are depicted. The 8 kidney nephron regions evaluated are : Glom, glomerulus; S1 and S3, the proximal tubule; mTAL, medullary thick ascending limb of Henle's loop; cTAL, cortical thick ascending limb of Henle's loop; DCT, distal convoluted tubule; CCD, cortical collecting duct; OMCD, outer medullary collecting duct. B-D) Gene Set Enrichment Analysis (GSEA) for differentially expressed genes in C1 as compared to C2 epi-clusters. E) Box-plot for EZH2 gene expression levels in normal kidneys and C1 and C2 epi-clusters.

