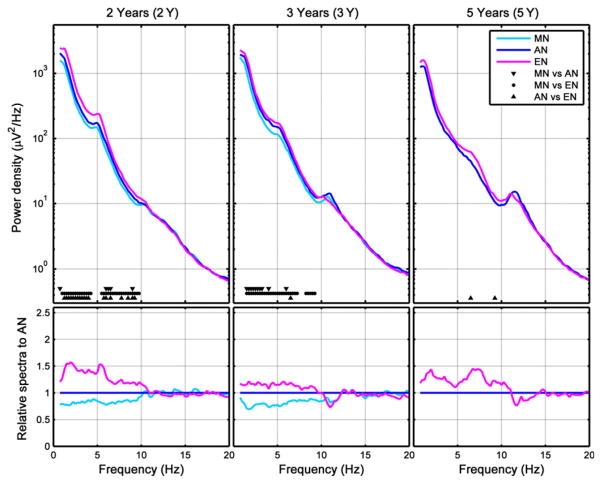
Figure 3.
Nap conditions: average power density spectra [first 27 min of artefact-free epochs of non-rapid eye movement (NREM) sleep] for absolute (top row) and relative data (bottom row, calculated relative to AN). Markers at bottom of subplots refer to significant differences between nap conditions (morning nap MN; afternoon nap AN; evening nap EN).

