FIG. 5.
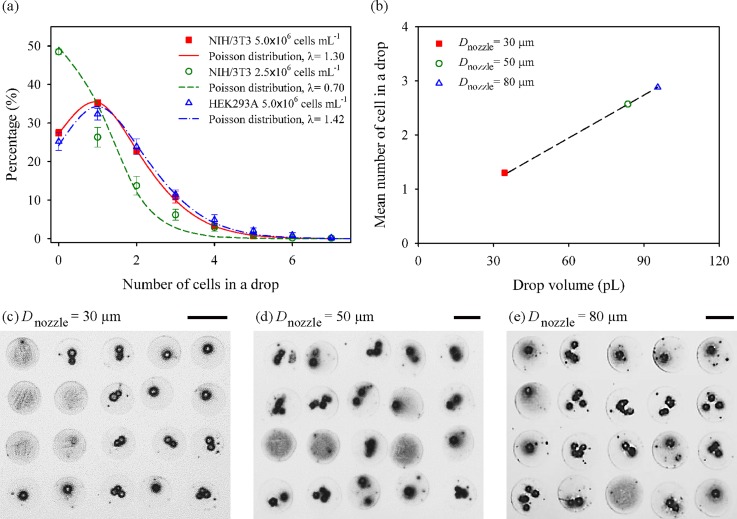
(a) Distributions of the number of cells in a printed drop with different NIH/3T3 cell concentrations (5.0 × 10⁶ and 2.5 × 10⁶ cells ml−1) and different cell types (NIH/3T3 and HEK293A). Each curve is fitted by Poisson distribution. (b) Effect of nozzle diameters on average cell number in one drop from Poisson distribution. (c)–(e) Dot array patterns formed by inkjet-printing with different nozzle diameters of 30, 50, and 80 μm, respectively. Scale bars are 100 μm.

