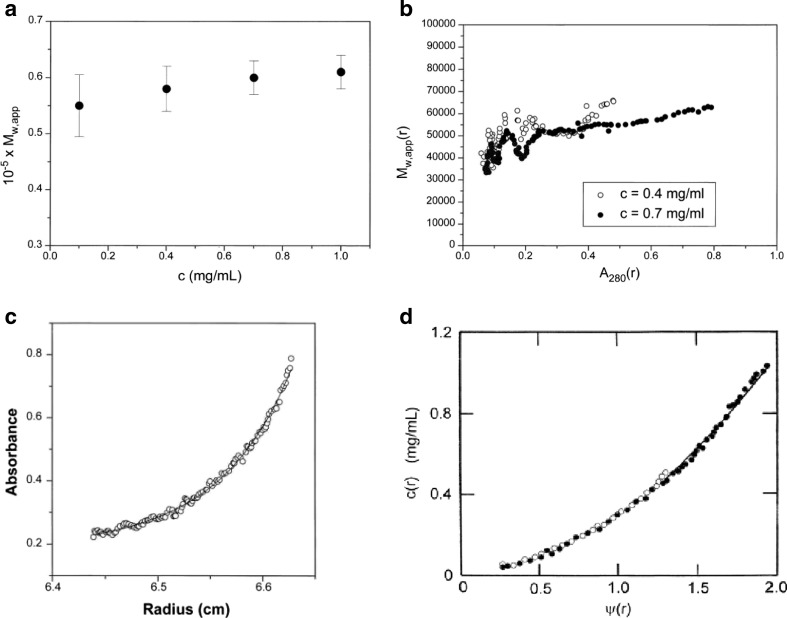
Fig. 5.
Sedimentation equilibrium analysis of the heterodimerization of the electron transfer flavoprotein ETF. The dimerization is of two equimolar components of molecular weight (M ) 28,900 and 33,700 Da, respectively. a The apparent weight-average molecular weight (M w,app) averaged over all radial positions in the ultracentrifuge cell from meniscus to cell base plotted against c for four different cell loading concentrations c showing a monomer–dimer system with a dimer molecular weight of ∼63 kDa (including FAD and AMP cofactors of collective M = 1120 Da) dissociating at lower concentration. b Plot of the ‘point’ apparent weight-average, Mw,app(r), evaluated at individual radial positions r as a function of concentration [expressed as UV-absorbance A(r) values at 280 nm] at those radial positions. Data sets for two loading concentrations are shown. Within error, they overlap, demonstrating a reversible interaction. c Modelling the concentration distribution in terms of an ideal dimerization. d As (c), but in terms of the radial function ψ(r). The fitted data in both c and d correspond to a Kd ∼ (1.5 ± 0.1) × 10−6 M, a strong interaction. Again, the overlap at two different loading concentrations is commensurate with a reversible association. Figure is from Cölfen et al. (1997), with kind permission of the European Biophysics Journal (Springer Science + Business Media)

