Figure 2.
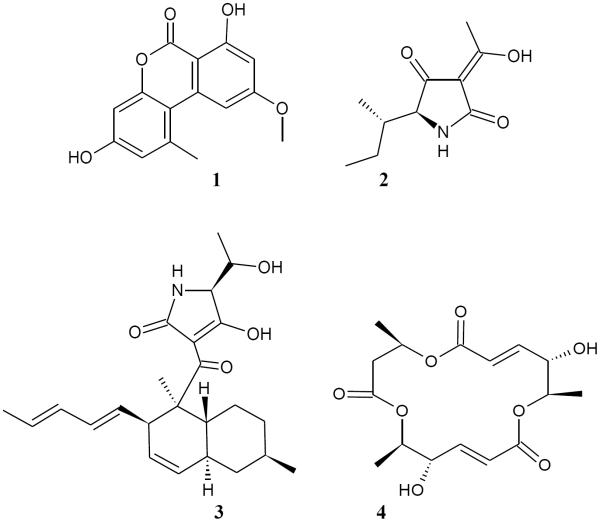
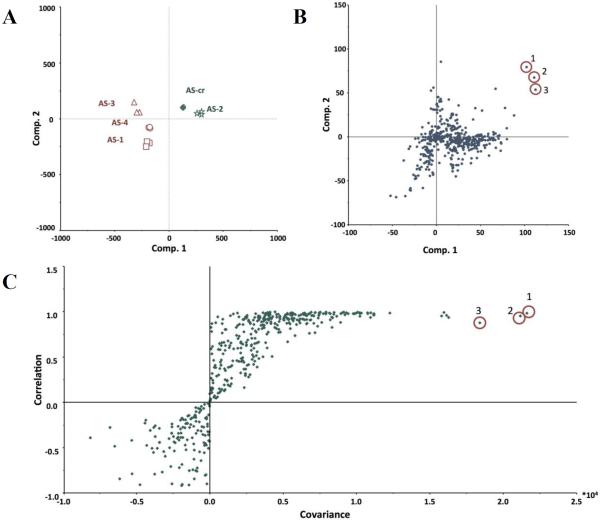
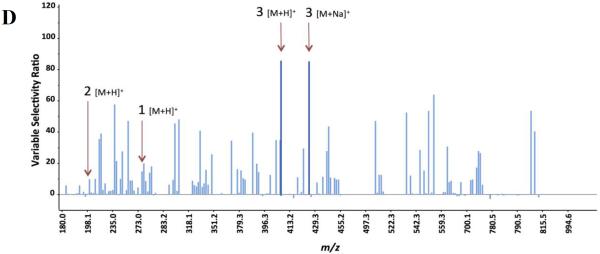
Marker ion selection from a biochemometric dataset. The biochemometric dataset was obtained from the mass spectral data coupled with bacterial growth inhibition data (against S. aureus SA1199) at a concentration of 100 μg/mL (Table 2). (A) Partial least squares (PLS) scores plot, showing the grouping of bioactive and non-bioactive fractions from Alternaria sp. (AS-CR and AS-1 – AS-4). Each fraction was analyzed in triplicate via UPLC-MS and was subjected to triplicate biological assays. Thus, the replicate datapoints represent both biological and technical variability. (B) Loadings plot from the PLS analysis of biochemometric data. Variables located in the same region in the loadings plot (B) as the bioactive groups AS-CR and AS-2 in the scores plot (A) have the highest positive correlation with the dependent variable (bioactivity). Thus, three ions corresponding to alternariol monomethyl ether (1), tenuazonic acid (2), and altersetin (3) were identified from visual analysis of the loadings plot as potentially most bioactive. (C) S-plot from PLS model of antibacterial activity of Alternaria sp. extract and fractions. The upper right quadrant are the peaks with highest correlation to bioactivity, and ions 1, 2, and 3 were also identified from the S-plot. (D) The selectivity ratio analysis of the PLS model data. The ratio relates the explained variance of the variable to the residual variance. Higher values (taller lines) represent a more significant contribution to the observed bioactivity. The selectivity ratio indicates compound 3 to have the highest activity, and does not find strong correlation for compounds 1 and 2.


